Prasanna

Texas Go Math Grade 7 Module 11 Quiz Answer Key

Refer to our Texas Go Math Grade 7 Answer Key Pdf to score good marks in the exams. Test yourself by practicing the problems from Texas Go Math Grade 7 Module 11 Quiz Answer Key.

Texas Go Math Grade 7 Module 11 Quiz Answer Key

11.1 Analyzing Categorical Data

Texas Go Math Grade 7 Module 11 Ready to Go On? Answer Key

The circle graph shows the results of 25 student votes for the new class pet. Find the number of votes for each animal.

Texas Go Math Grade 7 Module 11 Quiz Answer Key 2

Question 1.
bird _______
Answer:
Total number of students who voted = 25
Percentage of vote for the bird as pet = 56%
percentage of vote for bird
Texas Go Math Grade 7 Module 11 Quiz Answer Key 8
= 0.56 × 25
= 14
Hence, the number of votes for the bird is 14

Texas Go Math Grade 7 Module 11 Answer Key Question 2.
hamster ______
Answer:
Total number of students who voted = 25
Percentage of votes for the hamster as a pet = 12%
Texas Go Math Grade 7 Module 11 Quiz Answer Key 9
= 0.12 × 25
= 3
Hence, number of votes for hamster is 3

Question 3.
ferret _______
Answer:
Total number of students who voted = 25
Percentage of vote for the ferret as pet = 8%
Texas Go Math Grade 7 Module 11 Quiz Answer Key 10
= 0.08 × 25
= 2
Hence, number of votes for ferret is 2

Question 4.
snake ______
Answer:
Total number of students who voted = 25
Percentage of vote for the snake as pet = 24%
Texas Go Math Grade 7 Module 11 Quiz Answer Key 11
= 0.24 × 25
= 6
Hence, number of votes for snake is 6

11.2 Comparing Data Displayed in Dot Plots

Texas Go Math Grade 7 Module 11 Quiz Answer Key 1

The two dot plots show the number of miles run by 14 students at the beginning and at the end of the school year. Compare each measure of the two dot plots.

Grade 7 Math Module 11 Answer Key Question 5.
means ______
Answer:
Arranging the data of mites run by all the 14 students:
Miles run at start of school year : 5, 6, 6, 7, 7, 7, 7, 8, 8, 8, 8, 9, 9, 10
Miles run at end of school year : 6, 6, 7, 7, 8, 8, 8, 8, 9, 9, 9, 10, 10, 10
Texas Go Math Grade 7 Module 11 Quiz Answer Key 12

Question 6.
medians __________
Answer:
Arranging the data of miles run by all the 14 students:
Mites run at start of school year: 5, 6, 6, 7, 7, 7, 7, 8, 8, 8, 8, 9, 9, 10
Miles run at end of school year: 6, 6, 7, 7, 8, 8, 8, 8, 9, 9, 9, 10, 10, 10
Here, total number of terms are 14 which is an even number so the medians of the data will be the average of 7th and 8th term
Texas Go Math Grade 7 Module 11 Quiz Answer Key 13

7th Grade Quiz Module 11 Test Answers Question 7.
Ranges ________
Answer:
Arranging the data of miles run by att the 14 students:
Mites run at start of school year: 5, 6, 6, 7, 7, 7, 7, 8, 8, 8, 8, 9, 9, 10
Miles run at end of school year: 6, 6, 7, 7, 8, 8, 8, 8, 9, 9, 9, 10, 10, 10
Here, the range of mites run by the students will be the difference of maximum and minimum miles run by the students.
Range of start of school year = Max value – Min value
= 10 – 5
= 5
Range of start of school year = Max value – Min value
= 10 – 6
= 4

11.3 Comparing Data Displayed in Box Plots

Use the box plots of inches flown by two different model airplanes for the following exercises.

Texas Go Math Grade 7 Module 11 Quiz Answer Key 3

Question 8.
Which has a greater median flight length? _____________
Answer:
On observating the given box plot the length of air plane are:
Airplane A: 200, 208, 210, 225, & 234.
Airplane B: 180, 195, 204, 230, & 235.
Here total number of term is 5 which is an odd number, we know that when total number of terms is an odd then the median of the given data is middle term. So the median of length of airplane will be the 3rd term
Median of airplane A = 3rd term = 210
Median of airplane B = 3rd term = 204
Hence, the median length of airplane A is greater as compared to the length of airplane B.

Texas Go Math Grade 7 Answer Key Pdf Module 11 Test Question 9.
Which has a greater interquartile range? ______
Answer:
On observing the given box plot the lengths of the plane are:
Airplane A: 200, 208, 210, 225, & 234.
Airplane B: 180, 195, 204, 230, & 235.
Here the box shows the interquartile range. The interquartile angle is the difference between the upper and Lower quartile, which is represented by the length of the box.
Interquartile range of airplane A = Q3 – Q1 = 225 – 208 = 17
Interquartile range of airplane B = Q3 – Q1 = 230 – 195 = 35
Hence, interquartile range of airplane B is greater then airplane A

Question 1o.
Which appears to have a more predictable flight length? ______
Answer:
The more predictable flight length is by airplane A because the spread of airplane A is less as compared to the
airplane B Also the interquartile angle of airplane A is less as compared to the airplane B So when the length of
flight is compared airplane A is more predictable then airplane B

Essential Question

Question 11.
How can you use and compare data to solve real-world problems?
Answer:
In the real world, there are so many choices for you to decide which is better or not. Using and comparing data of
the choices helps to make a better decision. You can compare the data statistically to determine which is better.
This is a great help in decision making. For example, when you want to buy a car, you would gather information
about different cars and will compare their data to help you decide which should you purchase. Comparing data
will save you from making a wrong decision.

Using and comparing data helps to make a better decision.

Texas Go Math Grade 7 Module 11 Mixed Review Texas Test Prep Answer Key 

Selected Response
Chelsea is reading a 250-page book that is divided into five chapters. For 1-3, use the bar graph below.

Texas Go Math Grade 7 Module 11 Quiz Answer Key 4

Go Math Quiz For Grade 7 Module 11 Question 1.
What percent of the book’s pages are in Chapter 4?
(A) 24%
(B) 28%
(C) 35%
(D) 70%
Answer:
(B) 28%

Explanation:
Total number of pages given in book = 250
Number of pages in chapter 4 of book = 70
Texas Go Math Grade 7 Module 11 Quiz Answer Key 14
Hence, Option B (28%) is correct option

Question 2.
What percent of the book’s pages are in Chapters 3 and 4?
(A) 24%
(B) 28%
(C) 52%
(D) 65%
Answer:
(C) 52%

Explanation:
Total number of pages given in book = 250
Number of pages in chapter 3 of book = 60
Number of pages in chapter 4 of book = 70
Texas Go Math Grade 7 Module 11 Quiz Answer Key 15
Hence, Option C (52%) is the correct option

Texas Go Math Grade 7 Answer Key Quiz Question 3.
If Chelsea has read through the first half of Chapter 3, what percent of the book has she read?
(A) 25%
(B) 40%
(C) 44%
(D) 52%
Answer:
(B) 40%

Explanation:
Total number of pages given in book = 250
Number of pages in chapter 1 of book = 40
Number of pages in chapter 2 of book = 30
Number of pages in chapter 3 of book = 60
Total number of pages till 1st half of chapter 3 = 100
Texas Go Math Grade 7 Module 11 Quiz Answer Key 16
Hence, Option B (40%) is the correct option

Question 4.
What is -3\(\frac{1}{2}\) written as a decimal?
(A) -3.05
(B) -3.5
(C) -0.35
(D) -0.035
Answer:
(B) -3.5

Explanation:
Texas Go Math Grade 7 Module 11 Quiz Answer Key 17
Hence, option B(-3.5) is correct option

Go Math Module 11 Quiz Grade 7 Answer Key Question 5.
Which is a true statement based on the dot plots below?
Texas Go Math Grade 7 Module 11 Quiz Answer Key 5
(A) Set A has the lesser range.
(B) Set B has the greater median.
(C) Set A has the greater mean.
(D) Set B is less symmetric than Set A
Answer:
(B) Set B has the greater median.

Explanation:
On comparing both set A and set B we have conclusion:
Option A: is wrong because the range of set A is 10-60 and set B is 20-60
Option B: is correct because the median of set B is greater than set A
Option C: is wrong because the mean of set A is greater than set B
Option D: is wrong because set B is more symmetric at 40
Hence, option B is the correct option

Gridded Response

Question 6.
The dot plot shows the number of pencils each boy has at his desk in class.
Texas Go Math Grade 7 Module 11 Quiz Answer Key 6
Find the median for the number of pencils.
Texas Go Math Grade 7 Module 11 Quiz Answer Key 7
Answer:
From the given dot plot we can see that 3 boys has 1 pencils on desk, 4 boy has 2 pencils on desk, 2 boy has 3
pencils on desk and at last boy has 5 pencils on his desk. So arranging the given data in order.
1, 1, 1, 2, 2, 2, 2, 3, 3, 5
Total numbers of term are 10, so median will be average of 5th and 6th term.
Texas Go Math Grade 7 Module 11 Quiz Answer Key 18
Hence, median for number of pencils is 2
Table will be made as per below instruction:
1st column: mark + sign
2nd column : mark 0
3rd column : mark 0
4th column : mark 0
5th column : mark 2
6th column : mark 0
7th column : mark 0

Texas Go Math Grade 7 Module 11 Quiz Answer Key Read More »

Texas Go Math Grade 7 Lesson 12.3 Answer Key Comparing Populations

Refer to our Texas Go Math Grade 7 Answer Key Pdf to score good marks in the exams. Test yourself by practicing the problems from Texas Go Math Grade 7 Lesson 12.3 Answer Key Comparing Populations.

Texas Go Math Grade 7 Lesson 12.3 Answer Key Comparing Populations

Texas Go Math Grade 7 Lesson 12.3 Explore Activity 1 Answer Key  

Using Dot Plots to Compare Populations

You can compare two populations by taking a random sample of each population and comparing the samples using dot plots.

A test prep company gives its students a Pretest before the course and a Posttest after the course is completed. The test prep company picks a random sample of 10 students from each testing session.
Texas Go Math Grade 7 Lesson 12.3 Answer Key 1

A. Make a dot plot for the sample of Pretest scores.
Texas Go Math Grade 7 Lesson 12.3 Answer Key 2

B. Make a dot plot for the sample of Posttest sores.
Texas Go Math Grade 7 Lesson 12.3 Answer Key 3

C. Compare the dot plots. The plots have a similar center/spread but the Posttest values are shifted to the _____.

Reflect

Go Math Grade 7 Answer Key Pdf Comparing Populations Question 1.
What can you infer about the populations by comparing the dot plots for the samples?
Answer:
Comparing the dot plots of both sample we get information :

  • median of pretest score is 515 and the median of the posttest is 575. So the post-test score of the students are better than pretest score.
  • Range of the pretest score is 640 – 460 = 10 and the range of posttest score is 670 – 480 = 190. So the data of posttest score are more spread.
  • Mean of pretest score is 528 and the mean of posttest is 569.

Hence, we can say that Posttest scores of the students are better than the pretest score.

Median of pretest score is 515 and of posttest is 575.

Texas Go Math Grade 7 Lesson 12.3 Explore Activity 2 Answer Key  

Using Box Plots to Compare Populations

You can also compare two populations using random samples and box plots.
Texas Go Math Grade 7 Lesson 12.3 Answer Key 4

A survey of 7th graders asks girls and boys how many baseball caps they own.
Texas Go Math Grade 7 Lesson 12.3 Answer Key 5

A) Make a box plot for the number of baseball caps girls own.
Texas Go Math Grade 7 Lesson 12.3 Answer Key 6

B) Make a box plot for the number of baseball caps boys own.
Texas Go Math Grade 7 Lesson 12.3 Answer Key 7

C) Compare the box plots.
The plot for boys has a lesser /greater range, but a lesser/greater interquartile range. The middle 50% of caps was less spread out for the _____.

Reflect

Question 2.
What can you infer about the populations by comparing the box plots for the samples? Justify your answer.
Answer:
Comparing the dot plots of both sample we get information:

  • The median of girls is 7 and the median of the boys is 10. So the boys have more number of baseball caps as compared to girls.
  • Range of the girls is 18 – 3 = 15 and the range of boys is 18 – 7 = 11. So the data of girls sample are more spread.
  • Mean of pretest score is 7.4 and the mean of boys is 11.7. Hence, we can say that boys has more number of baseball caps as compared to girls baseball cap.

Median of girls is 7 and of boys it is 10.

Texas Go Math Grade 7 Lesson 12.3 Explore Activity 3 Answer Key  

You can use the means and ranges of two random samples to compare the populations that the random samples represent.

Paula and Daniel wanted to determine the average word length in two books. They took a random sample of 12 words each and counted the length of each word from each book.
Texas Go Math Grade 7 Lesson 12.3 Answer Key 8
Step 1
Calculate the mean for Book 1.
Texas Go Math Grade 7 Lesson 12.3 Answer Key 9
The mean for Book 1 is ______ letters long.
Step 2
Find the range for Book 1.
Texas Go Math Grade 7 Lesson 12.3 Answer Key 10
Subtract the least word length from the greatest word length.
Step 3
Calculate the mean for Book 2.
Texas Go Math Grade 7 Lesson 12.3 Answer Key 11
The mean for Book 2 is __ letters long.
Step 4
Find the range for Book 2.
___ + ___ = ____
Subtract the least word length from the greatest word length.

You can infer from the mean of each population that the overall average word length for Book 1 is less than/the same as/greater than the average word length for Book 2.
You can infer from the range of each population that the length of the words in Book 1 varies less than/in the same way as/more than

Reflect

Texas Go Math Grade 7 Answers Lesson 12.3 Answer Key Question 3.
What are the populations from which the samples were taken?
Answer:
It is given in the problem Paula and Daniel want to determine the average word length in two books so they take a random sample of 12 words from each book and count their length. Hence, here population will be all (each and every) the words in both books, from where Paula and Daniel randomly select 12 words to calculate the average length.
Hence, the population will be all the words in both books.

The population will be all the words in both books.

Texas Go Math Grade 7 Lesson 12.3 Guided Practice Answer Key  

Carol wants to know how many people live in each household in her town. She conducts two random surveys of 10 people each and asks how many people live in their homes. Her results are listed below. Use the data for 1 -6. (Explore Activities 1, 2 and 3)

Sample A: 1, 6, 2, 4, 4, 3, 5, 5, 2,8

Sample B: 3, 4, 5, 4, 3, 2, 4, 5, 4, 4

Question 1.
Make a dot plot for Sample A.
Texas Go Math Grade 7 Lesson 12.3 Answer Key 12
Answer:
Texas Go Math Grade 7 Lesson 12.3 Answer Key 18
All the blue dot represent the sample.

Question 2.
Make a dot plot for Sample B.
Texas Go Math Grade 7 Lesson 12.3 Answer Key 13
Answer:
Texas Go Math Grade 7 Lesson 12.3 Answer Key 14
All the red dot represent the sample.

Question 3.
Find the mean and range for Sample A.
Mean: ____ Range: _____
Answer:
Given sample A: 1, 6, 2, 4, 4, 3, 5, 5, 2, 8
Texas Go Math Grade 7 Lesson 12.3 Answer Key 20
Range = Maximum value – Minimum vaLue
= 8 – 1
Mean : 4
Range: 7

Texas Go Math Grade 7 Compare Populations Answer Key Question 4.
Find the mean and range for Sample A.
Mean: ____ Range: _____
Answer:
Given sample A:3, 4, 5, 4, 3, 2, 4, 5, 4, 4
Texas Go Math Grade 7 Lesson 12.3 Answer Key 21
Range = Maximum value – Minimum value
= 5 – 2
= 3
Mean:3.8
Range:3

Question 5.
What can you infer about the population based on Sample A? Explain.
Answer:
After plotting the Dot Plot of sample A in question 1 we can observe that the dot plot is almost symmetrical about 4 which means that the mean of given sample A is 4. And also the maximum number of people who lives in household is 8 and the minimum number is 1. So the range is 8 – 1 = 7. In most of the cases the number of people who lives in household are 2, 4, or 5.
The mean (4) and the range (7) of sample A is greater as compared to the sample B.

Mean and range of sample A is greater than sample B.

Question 6.
What can you infer about the population based on Sample B? Explain.
Answer:
After plotting the Dot Plot of sample B in question 2 we can observe that the dot plot is almost symmetrical about 4 which means that the mean of given sample B is near by 4. And also the maximum number of people who live in the household is 5 and the minimum number is 2. So the range is 5 – 2 = 3. But in most of cases the number of
people who live in the household are 4.
The mean (3.8) and the range (3) of sample B is smaller as compared to sample B.

The mean and range of sample B is smaller than sample A

Essential Question Check-in

Texas Go Math Grade 7 Answer Key Pdf Lesson 12.3 Question 7.
How can you use random samples to compare two populations?
Answer:
By using the random sample A and B we can conclude that:

  • In case of sample A, there are exact 4 people in the household of maximum people whereas in case of sample B the maximum household has people less than 4. So average number of people living in household in both case is 4.
  • Sample A has greater spread than Sample B which means that range of sample A is more than sample B. So number of people in household in sample A varies more rapidly than sample B.

By comparing the mean of random sample we can compare the average number of people in a household in both cases.

Texas Go Math Grade 7 Lesson 12.3 Independent Practice Answer Key  

The high school is buying shoes for the boy’s football team and boy’s soccer team. The sizes of a random sample of the players’ feet is shown.

Texas Go Math Grade 7 Lesson 12.3 Answer Key 14

Question 8.
Find the mean for both lists. What can you infer about the populations by comparing the means?
Answer:
Sample of football team shoe size: 6, 8, 9, 10, 10, 10, 10, 10, 11, 13
Sample of soccer team shoe size: 3, 5, 5, 6, 6, 6, 6, 6, 7, 8, 10
Texas Go Math Grade 7 Lesson 12.3 Answer Key 22
Average shoe size of team in case of football team is 9.82 but in case of soccer team the average shoe size of team 6.18.

Mean of football team is 9.82 and of soccer team is 6.18

Question 9.
Find the range of both lists. What can you infer about the populations by comparing the ranges?
Answer:
Sample of football team shoe size : 6, 8, 9, 10, 10, 10, 10, 10, 11, 13
Sample of soccer team shoe size: 3, 5, 5, 6, 6, 6, 6, 6, 7, 8, 10
Range of football team shoe size = Maximum value – Minimum value
= 13 – 6
= 7
Range of soccer team shoe size = Maximum value – Minimum value
= 10 – 3
= 7
Range of both football team and soccer team is same which is 7. This means that the spread of data (shoe size of both football and soccer team) are same in both case.

Range is same in both case.

7th Grade Plot Diagram Answer Key Go Math Practice Book Question 10.
Make a box plot for each sample.
Texas Go Math Grade 7 Lesson 12.3 Answer Key 15
Answer:
Texas Go Math Grade 7 Lesson 12.3 Answer Key 23
Texas Go Math Grade 7 Lesson 12.3 Answer Key 24
Box plot of both soccer and football team is shown.

Question 11.
Draw Conclusions Compare the box plots. What do you notice from the visual comparison?
Answer:
On comparing the box plot of both the team we can collude that the size of box in both case are same. Also the the size of both the whisker is same which means the range are same. And the central line (Median) in case of football team is greater than the soccer team.

Size of whisker is same in both case.

Mrs. Garcia asked a random sample of her students the number of books they read over the summer. Use these data for 12-14.

Texas Go Math Grade 7 Lesson 12.3 Answer Key 16

Question 12.
Make dot plots for each sample to illustrate the books read in each class.
Texas Go Math Grade 7 Lesson 12.3 Answer Key 17
Answer:
Texas Go Math Grade 7 Lesson 12.3 Answer Key 25
Texas Go Math Grade 7 Lesson 12.3 Answer Key 26
Maximum number of book read by both class A and Class B are 10

Question 13.
Describe two similarities and two differences between the dot plots.
Answer:

  • Two similarities between the dot plot of class A and B are :
    1. In both the clot plot the maximum value or maximum number of b00k read is lo.
    2. Spread of data in b0th the dot plot are almost similar.
  • Two differences between the dot plot of class A and B are
    1. Median of class A is 7.5 and class B is 3.5
    2. Minimum Number of book read by class A students is 1 but in case of class B students it is 2.

The median of class A is 7.5 and of class B is 3.5

Go Math 7th Grade Answer Key Pdf Lesson 12.3 Question 14.
Make a Conjecture Without doing any calculations, can you tell which class has read more books? Explain. What calculation would you perform to verify your response?
Answer:
Yes, we can tell which class has read more books without calculation.
By seeing the dot plot of both classes A and B we can say that class A has read more books than class B Because in the dot plot of class A the centre point (around which data are present) is between 7 and 8 but the dot plot of class B the centre point (around which data are present) is between 3 and 4.
Texas Go Math Grade 7 Lesson 12.3 Answer Key 27
Median of class A is 7.5 and of class B is 3.5

Texas Go Math Grade 7 Lesson 12.3 H.O.T. Focus On Higher Order Thinking Answer Key 

Question 15.
Communicate Mathematical Ideas Compare plotting points on a number line with plotting points on a dot plot.
Answer:
When any point is plotted on the number line, two variable x-coordinate and y-coordinate are needed and the y- coordinate of the point gives the value for corresponding value of x-coordinate. But in case of the dot plot each single dot represent the data from sample. If number of dot is more than one at single point then it means that data is repeated in the random sample
Texas Go Math Grade 7 Lesson 12.3 Answer Key 28
In dot plot each dot represent the data from random sample.

Question 16.
Analyze Relationships If you are given a box plot without any numbers on the number line, what can you tell about the data used to make the plot?
Answer:
Boxplot of any data tells or indicate that how the values of data from random sample are spread out. Box plot of any data indicate the median, range, maximum and minimum values of data sample. The box of box plot represent the upper and lower quartile of given data sample. So if boxplot is given without any numbers on number line we can only tells that how data from sample are distributed about the central point

If the whisker of the boxplot is larger, this means that data is largely spread out from the center point but if the whisker is very small or has no whisker this means most of the data are near the central point.

Boxplot indicates the median, range, max, and min value of the data sample.

Lesson 12.3 Using Proportional Relationships Answer Key Question 17.
Draw Conclusions Using at least ten points, create two distinct data sets with the same mean and range. Will their dot plots be the same? Could their box plots be the same?
Answer:
Let the first data sample be A: 2, 3, 7, 5, 5, 3, 8, 6, 5, 6
Texas Go Math Grade 7 Lesson 12.3 Answer Key 29
Range of sample A = Maximum value – Minimum value
= 8 – 2
= 6
The box plot of the given data sample is shown below:
Texas Go Math Grade 7 Lesson 12.3 Answer Key 30
Let the first data sample be B: 4, 5, 4, 4, 5, 4, 4, 6, 4, 10
Texas Go Math Grade 7 Lesson 12.3 Answer Key 31
Range of sample A = Maximum value – Minimum value
= 10 – 4
= 6
The box plot of the given data sample is shown below:
Texas Go Math Grade 7 Lesson 12.3 Answer Key 32
No, their dot plots cannot be the same because the dot plot depends on the value of data given in the sample.
No, their boxplot also cannot be the same because the maximum and minimum values of given data are different in both cases.

No, their dot plots cannot be the same.

Texas Go Math Grade 7 Lesson 12.3 Answer Key Comparing Populations Read More »

Texas Go Math Grade 7 Lesson 11.3 Answer Key Comparing Data Displayed in Box Plots

Refer to our Texas Go Math Grade 7 Answer Key Pdf to score good marks in the exams. Test yourself by practicing the problems from Texas Go Math Grade 7 Lesson 11.3 Answer Key Comparing Data Displayed in Box Plots.

Texas Go Math Grade 7 Lesson 11.3 Answer Key Comparing Data Displayed in Box Plots

Essential Question
How do you compare two sets of data displayed in box plots?

Texas Go Math Grade 7 Lesson 11.3 Explore Activity Answer Key  

Analyzing Box Plots
Box plots show five key values to represent a set of data, the least and greatest values, the lower and upper quartile, and the median. To create a box plot, arrange the data in order, and divide them into four equal-size parts or quarters. Then draw the box and the whiskers as shown.

The number of points a high school basketball player scored during the games he played this season are organized in the box plot shown.
Texas Go Math Grade 7 Lesson 11.3 Answer Key 1
Texas Go Math Grade 7 Lesson 11.3 Answer Key 2

A. Find the least and greatest values.
Least value: _______________ Greatest value: _________

B. Find the median and describe what it means for the data.

C. Find and describe the lower and upper quartiles.

D. The interquartile range is the difference between the upper and lower quartiles, which is represented by the length of the box. Find the interquartile range.
Q3 – Q1 = ___ – ___ = ____

Math Talk
Mathematical Processes
How do the lengths of the whiskers compare? Explain what this means.

Reflect

Go Math Grade 7 Lesson 11.3 Answer Key Question 1.
Why is one-half of the box wider than the other half of the box?
Answer:
In the box plot of data representation, the box represents 50% or one-half of the data and the center point is the median of the given data. Each smaller box with a median point as a divider represents 25% or one-fourth of the total data. So if one-half of the box is wider than the other half, this means that the spread of data or range of that half box is larger as compared to the other half box.
Range of wider box = 27.5 – 21 = 6.5
Range of smaller box = 21 – 17.5 = 3.5

The Spread of data in a wider box will be greater than smaller box.

Example 1.
The box plots show the distribution of times spent shopping by two different groups.
Texas Go Math Grade 7 Lesson 11.3 Answer Key 3

A. Compare the shapes of the box plots.
The positions and lengths of the boxes and whiskers appear to be very similar. In both plots, the right whisker is shorter than the left whisker.

B. Compare the centers of the box plots.
Group A’s median, 47.5, is greater than Group B’s, 40. This means that the median shopping time for Group A is 7.5 minutes more.

C. Compare the spreads of the box plots.
The box shows the interquartile range. The boxes are similar in length.
Group A: 55 – 30 = 25 min Group B: 59 – 32 = 27 min
The length of a box plus its whiskers shows the range of a data set. The two data sets have similar ranges.

Math Talk
Mathematical Processes
Which store has the shopper who shops longest? Explain how you know.

Reflect

Question 2.
Which group has the greater variability in the bottom 50% of shopping times? The top 50% of shopping times? Explain how you know.
Answer:
In box plot of data representation, the box represents 50% or one-half of the data and centre point is the
median of given data So left side of median or centre point represents bottom 50% of data and the right side
represents the top 50% of the data. Now calculating the top and bottom 50% of data.
For Group A:
Range of top 50% of data = Maximum value – Median
= 65 – 48
= 17
Range of bottom 50% of data = Median – Minimum value
= 48 – 5
= 43
For Group B:
Range of top 50% of data = Maximum value – Median
= 66 – 40
= 26
Range of bottom 50% of data = Median – Minimum value
= 40 – 8
= 32
Hence, Group A has greater variability is h. bottom 50% of the shopping times and Group B has greater variability in top 50% of shopping times.

Group A in botton 50%
Group B in top 50%

Your Turn

Question 3.
The box plots show the distribution of weights in pounds of two different groups of football players. Compare the shapes, centers, and spreads of the box plots.
Texas Go Math Grade 7 Lesson 11.3 Answer Key 4
Answer:
Comparing the shape, centre, and spread of the data in box plot:
Shape of box plots: Both right and left whisker of Group A is Longer as compared to whisker of Group B.
Center of box plots: Median or centre of group A is 249 and of Group B is 265. So median of the group B is more
than the median of group A.
Spread of box plots: Spread or range of the group A is more as compared to spread of group B. Also the size of
box of group A is longer than the group B which means that the interquartile range of group A will be greater than group B.

The median of group A is 249 and of group B is 250.

Example 2.
The box plots show the distribution of the number of team wristbands sold daily by two different stores over the same time period.
Texas Go Math Grade 7 Lesson 11.3 Answer Key 5
A. Compare the shapes of the box plots.
Store A’s box and right whisker are longer than Store B’s.
B. Compare the centers of the box plots.
Store A’s median is about 43, and Store B’s is about 51. Store A’s median is close to Store B’s minimum value, so about 50% of Store A’s daily sales were less than sales on Store B’s worst day.
C. Compare the spreads of the box plots.
Store A has a greater spread. Its range and interquartile range are both greater. Four of Store B’s key values are greater than Store A’s corresponding value. Store B had a greater number of sales overall.

Your Turn

Comparing Data Displayed in Box Plots Lesson 11.3 Answer Key Question 4.
Compare the shape, center, and spread of the data in the box plot with the data for Stores A and B in the two box plots in Example 2.
Texas Go Math Grade 7 Lesson 11.3 Answer Key 6
Answer:
Comparing the shape, center, and spread of the data in a box plot:
Shape of box plots: The right whisker of the given box pLot is longer than the right whisker of store B but smaller than the right wisher of store A
Center of box plots: The median or centre of given box plot is tata, median of store A is 43 and the median of store B is 51. The median of store B is the highest.
Spread of box plots: Spread or range of the given box plot is greater than the store B box plot but smaller than
the spread of the store A.

Median of given box plot is 44 and of store A is 43 and of store B is 51.

Texas Go Math Grade 7 Lesson 11.3 Guided Practice Answer Key  

For 1-3, use the box plot Terrence created for his math test scores. Find each value. (Explore Activity)

Question 1.
Minimum = ________ Maximum = ____
Answer:
On observing the given box plot Terrence of math test scores scores are: 72, 75, 79, 85, & 88.
Minimum = 72
Maximum = 88

Texas Go Math Grade 7 Lesson 11.3 Answer Key 7

Question 2.
Median = ___
Answer:
On observing the given box plot Terrence’s math test scores scores are:
72, 75, 79, 85, & 88.
Here total number of terms is 5 which is an odd number. We know that when a total number of terms is odd then the median of the given data is the middle term. So the median of the math test scores will be the 3rd term.
Median = 3rd term = 79

Comparing Box Plots Go Math Grade 7 Answer Key Pdf Question 3.
Range = __________ IQR = __________
Answer:
On observing the given box plot Terrence’s math test scores are:
72, 75, 79, 85, & 88.
Here, the range of math test scores by the students will be the difference between the maximum and minimum scores of the students.
Range = Max value – Min value = 88 – 72 = 16

For 4-7, use the box plots showing the distribution of the heights of hockey and volleyball players. (Example 1 and 2)

Texas Go Math Grade 7 Lesson 11.3 Answer Key 8

Question 4.
Which group has a greater median height? ________
Answer:
On observing the given box plot the heights of player are:
Hockey players: 64, 66, 70, 76, & 78.
Volleyball players: 67,68, 74, 78, & 85.
Here total number of term is 5 which is an odd number. We know that when total number of terms is an odd then the median of the given data is middle term. So the median of height of players will be the 3rd term.
Median of hockey player = 3rd term = 70
Median of volleyball player = 3rd term = 74
Hence, the median height of volleyball players are greater as compared to the median height of hockey players.

Question 5.
Which group has the shortest player? _____________ ______________
Answer:
On observing the given box plot the heights of the player are:
Hockey players: 64, 66, 70, 76, & 78.
Volleyball players: 67, 68, 74, 78, & 85.
Here on comparing the heights of both group hockey and volleyball players, we can see that the minimum height of a hockey player is 64 inches and the minimum height of a volleyball player is 67 inches. So the shortest player is 64 inches and belongs to the hockey group.
Hence, the hockey group has the shortest player 64 inches.

Lesson 11.3 Comparing Box Plots 7th Grade Question 6.
Which group has an interquartile range of about 10? __________________
Answer:
On observing the given box plot the heights of the player are:
Hockey players: 64, 66, 70, 76, & 78.
Volleyball players: 67, 68, 74, 78, & 85.
Here the box shows the interquartile range. The interquartile angle is the difference between the upper and lower quartile, which is represented by the length of the box
Interquartile range of hockey group = Q3 – Q1 = 78 – 68 = 10
Interquartite range of volleyball group = Q3 – Q1 = 76 – 66 = 10
Hence, both group has an interquartile range of 10

Both group has an interquartile range of 10

Essential Question Check-In

Question 7.
What information can you use to compare two box plots?
Answer:
By seeing and comparing box plot of both the data we can conclude :

  • The range of heights of volleyball group is greater then as compared to the hockey group.
  • The volleyball group has greater spread then hockey group.
  • Median of hockey group is greater.
  • Interquartile range of both group are same.

Volleyball group has greater spread

Texas Go Math Grade 7 Lesson 11.3 Independent Practice Answer Key  

For 8-11, use the box plots of the distances traveled by two toy cars that were jumped from a ramp.

Texas Go Math Grade 7 Lesson 11.3 Answer Key 9

Question 8.
Compare the minimum, maximum, and median of the box plots.
Answer:
The distance travelled by both car are:
Car A: 165, 170, 180, 195, 210
Car B: 160, 175, 185, 200, 205
Minimum and Maximum of Car A = 165 & 210
Minimum and Maximum of Car B = 160 & 205
The total number of terms in both cases is 5 which is odd and we know that in the case of an odd number, the median is the middle term. So 3rd term will be the median in both cases.
Median of car A = 180
Median of car B = 185

Go Math Comparing Data Displayed in Box Plots Lesson 11.2 Answer Key Question 9.
Compare the ranges and interquartile ranges of the data in box plots.
Answer:
The distance traveled by both car are:
Car A: 165, 170, 180, 195, 210
Car B: 160, 175, 185, 200, 205
We know that Range = Max value – Min value
Range of Car A = 210 – 165 = 45
Range of Car A = 205 – 160 = 45
Interquartile of car A = 195 – 170 = 25
Interquartite of car B = 200 – 175 = 25

Question 10.
What do the box plots tell you about the jump distances of two cars?
Answer:
On comparing the box Plots data of the two cars are:

  • The range of both cars A and B are the same which is 13.
  • The interquartile of both cars A and B are the same which is 25.
  • The median of the car B is greater as compared to the car A.

range and interquartile of both cars are the same.

Question 11.
Critical Thinking What do the whiskers tell you about the two data sets?
Answer:
The length of the whisker shows the range of the a data set.
The left whiskers of the car A is smaLler then the left whiskers of the car B and the right whiskers of car A is longer then the right whiskers of car B but over all length of the whiskers of both the car A and Car B is same. This means that the range of two data sets are same.

Range of two data sets are same.

For 12-14, use the box plots to compare the costs of leasing cars in two different cities.

Texas Go Math Grade 7 Lesson 11.3 Answer Key 10

Question 12.
In which city could you spend the least amount of money to lease a car? The greatest?
Answer:
The cost of leasing cars in two different cities are:
City A: 425, 450, 475, 550, 600
City B : 400, 425, 450, 475, 625
Mean of the cost in city A = \(\frac{425+450+475+550+600}{5}\)
= \(\frac{2500}{5}\)
= 500
Mean of the cost in city B = \(\frac{400+425+450+475+625}{5}\)
= \(\frac{2375}{5}\)
= 475
Hence, in City B it will take the least amount to lease a car and it City A it will take the greatest amount to lease a car.
Least in city B and greatest in city B.

Go Math Grade 7 Lesson 11.3 Answer Key Question 13.
Which city has a higher median price? How much higher is it?
Answer:
The cost of leasing cars in two different cities are:
City A: 425, 450, 475, 550, 600
City B: 400, 425, 450, 475, 625
Here total number of terms is 5 which is an odd number. And we know that the number of terms is odd then the median is middle term. So in this case the median will be the 5th term of the given data.
Median price of city A = 3rd term = 475
Median price of city b = 3rd term = 450
Hence, the median price of city A is higher as compared to the median price of the city B.
The median price of city A is higher.

Question 14.
Make a Conjecture In which city is it more likely to choose a car at random that leases for less than $450? Why?
Answer:
In city B it is more likely to choose a car at random that leases for less than $450.
Because in city A only two data shows that we can lease the car for $450 or less but in case of city B the three data shows that we can lease a car for $450 or less. So the chances of leasing a car for less than $450 is more in case of city B.

Question 15.
Summarize Look back at the box plots for 12-14 on the previous page. What do the box plots tell you about the costs of leasing cars in those two cities?
Answer:
On comparing the box plot of the city A and city B we can see that box of city A is longer than the box of city B. So the interquartile range of the city A is more as compared to the interquartile range of city B. This means that the cost of leasing a car in city B does not vary much at different place inside city and is around its median price which is $450 whereas in case of city A tile price for leasing a car varies much as compared to the median price of city A.

Median price of city A is higher than median price of city B

Texas Go Math Grade 7 Lesson 11.3 H.O.T. Focus On Higher Order Thinking Answer Key 

Question 16.
Draw Conclusions Two box plots have the same median and equally long whiskers. If one box plot has a longer box than the other box plot, what does this tell you about the difference between the data sets?
Answer:
In the box plot of data representation, the box represents 50% of the data and the left and right whiskers both represent the other 50% of the data.
If two box plots have the same median and equally long whiskers but one box is longer than the other box, then this means that the interquartile range (higher quartile – tower quartile) of the longer box data set must be greater than the interquartile range of the smaller box.

The longer box will have a greater interquartile range.

Question 17.
Communicate Mathematical Ideas What can you learn about a data set from a box plot? How is this information different from a dot plot?
Answer:
Using a box plot, you can determine the least and greatest values, the lower and upper quartiles, and the median
Furthermore, you could also determine the interquartile range (the difference between the upper and lower
quartile). The difference between the box plot and the dot plot is that the box plot shows the summary of the data set
while the dot plot shows all the values. For a dot plot, in order to determine the median, you still need to calculate it.
Also, dot plots only work in a small set of values while box plots work in large data sets.

The median, least, and greatest values and the lower and upper quartiles of a given data set

Question 18.
Analyze Relationships In mathematics, central tendency is the tendency of data values to cluster around some central value. What does a measure of variability tell you about the central tendency of a set of data? Explain.
Answer:
The measure of variability tells us how much diversity there is in a distribution of data, or how much is data scattered
from the central value.

The measure of variability is how much diversity there is in a distribution of data.

Texas Go Math Grade 7 Lesson 11.3 Answer Key Comparing Data Displayed in Box Plots Read More »

Texas Go Math Grade 7 Unit 5 Study Guide Review Answer Key

Refer to our Texas Go Math Grade 7 Answer Key Pdf to score good marks in the exams. Test yourself by practicing the problems from Texas Go Math Grade 7 Unit 5 Study Guide Review Answer Key.

Texas Go Math Grade 7 Unit 5 Study Guide Review Answer Key

Applications of Geometry Concepts

Essential Question
How can you apply geometry concepts to solve real-world problems?

Example 1
Find (a) the value of x and (b) the measure of ∠APY.
a. ∠XPB and ∠YPB are supplementary.
3x + 78° = 180°
3x = 102°
x = 34°
Texas Go Math Grade 7 Unit 5 Study Guide Review Answer Key 1

b. ∠APY and ∠XPB are vertical angles,
m∠APY = m∠XPB = 3x = 102°

Example 2
Find the area of the composite figure. It consists of a semicircle and a rectangle.
Texas Go Math Grade 7 Unit 5 Study Guide Review Answer Key 2
Area of semicircle = o.5(πr2)
≈ 0.5(3.14)25
≈ 39.25 cm2
Area of rectangle = lw
= 10(6)
= 60 cm2
The area of the composite figure is approximately 99.25 square centimeters.

Texas Go Math Grade 7 Unit 5 Exercises Answer Key

Question 1.
Find the value of y and the measure of ∠YPS (Lesson 9.1)
Texas Go Math Grade 7 Unit 5 Study Guide Review Answer Key 3
Answer:
Angle on the straight line SPR will be 180° and the ∠YPS and YPR will be supplementary to each other so, the
sum of both angle will be 180°.
∠YPS + ∠YPR = 180°
∠YPS + 140° = 180
∠YPS = 180 – 140
∠YPS = 40°
Also ∠YPS and ∠RPZ are vertically opposite angle so both the angle will be equal in measure.
∠RPZ = ∠YPS
5y = 40°
y = \(\frac{40}{5}\)
y = 8°
∠YPS = 40°

Find the circumference and area of each circle. Round to the nearest hundredth. (Lessons 9.2, 9.3)

Unit 5 End of Unit Assessment Answer Key Grade 7 Question 2.
Texas Go Math Grade 7 Unit 5 Study Guide Review Answer Key 4
Answer:
Given diameter of the circle = 22 inch
Circumference of circle with diameter “D” is = πD
Circumference of circle = 22 . π
= 22 × 3.14 (π = 3.14)
≈ 69 inch
Area of circle with diameter “D” is = \(\frac{\pi D^{2}}{4}\)
Area of circle = \(\frac{\pi \cdot 22^{2}}{4}\)
= \(\frac{3.14 \times 484}{4}\)
≈ 380 inch2
Circumference is 69 inch and area is 380 inch2

Question 3.
Texas Go Math Grade 7 Unit 5 Study Guide Review Answer Key 5
Answer:
Given radius of the circle = 4.5 m
Circumference of circle with radius “r” is = 2πr
Circumference of circle = 2π × 4.5
= 9 × 3.14 (π = 3.14)
= 28.26 m
Area of circle with radius “r” is = πr2
Area of circle = π × 452
= 3.24 × 20.25 (π = 3.14)
= 65.61 m2
Circumference is 28.26 m and area is 65.61 m2.

Find the area of each composite figure. Round to the nearest hundredth if necessary. (Lesson 9.4)

Question 4.
Texas Go Math Grade 7 Unit 5 Study Guide Review Answer Key 6
Answer:
Side length of the square = 9 in
Height of the triangle = 9 in
Base of the triangle = 13 – 9 = 4 in
Area of the composite figure will be the sum of area of square and the triangle.
Area of square = side2
= 92 in2
= 81 in2

Area of triangle = \(\frac{1}{2}\) × Base × Height
= \(\frac{1}{2}\) × 4 × 9 in2
= 18 in2
Area of composite figure = Sum of area of square and triangle
= 81 + 18 in2
= 99 in2
Hence, area of the composite figure will be 99 in2.
Area of the composite figure will be 99 in2

Question 5.
Texas Go Math Grade 7 Unit 5 Study Guide Review Answer Key 7
Answer:
Length ot the rectangle = 20 cm
Width of the rectangle = 16 cm
Radius of the semi circle = \(\frac{16}{2}\) = 8 cm
Area of the composite figure will be the sum of area of rectangle and the semi circle.
Area of rectangle = Length × width
= 16 × 20 in2
= 320 in2
Texas Go Math Grade 7 Unit 5 Study Guide Review Answer Key 22
Area of composite figure = Sum of area of rectangle and semi circle
= 320 + 100.18 cm2
≈ 420 cm2
Hence, area of the composite figure will be 420 cm2.

Volume and Surface Area

Example
The height of the figure whose net is shown is 8 feet. Identify the figure. Then find its volume, lateral area, and total surface area.
The figure is a rectangular pyramid.
Texas Go Math Grade 7 Unit 5 Study Guide Review Answer Key 8
The volume of the rectangular pyramid is 384 cubic feet, the lateral surface area is 192 square feet, and the total
surface area is 336 square feet.

Exercises

7th Grade Unit 5 Study Guide Answer Key Question 1.
Identify the figure represented by the net. Then find its lateral area and total surface area. (Less0n 10.3)
Texas Go Math Grade 7 Unit 5 Study Guide Review Answer Key 9
Answer:
The figure represented by the net is a triangular prism.
Lateral area:
One 13 ft. by 10 ft rectangle;
Two 13 ft by 13 ft. rectangles.
1 . (13 . 10) = 130
2 . (13 . 13) = 338
Lateral area: 130 + 338 = 468 ft2.
The base has the shape of triangLe with lenght of 10 ft and height of 15 ft.
Base area:
2 . (\(\frac{1}{2}\) . 10 . 15) = 150 ft2
The total surface area is 468 + 150 = 618 ft2.

Lateral area: 468 ft2.
The total surface area is 618 ft2.

Find the volume of each figure. (Lessons 10.1,10.2)

Question 2.
Texas Go Math Grade 7 Unit 5 Study Guide Review Answer Key 10
Answer:
l = 7 in Length of base
w = 5 in Width of base
h = 12 in Height of a prism
Find the area of the base B. A prism has a base that is rectanguar, so use the formula:
B = l . w = 7 . 5 = 35 in2
Use the formula for the volume of a rectangular prism.
V = B . h = 35 . 12 = 420 in3
The volume of a rectangular prism is 420 in3.

Question 3.
Texas Go Math Grade 7 Unit 5 Study Guide Review Answer Key 11
Answer:
A pyramid has a base that is right triangle.
a = 4 m Length of one side of the triangle
b = 6 m Length of other side of the triangle
h = 9m Heightofapyramid
Find the area of the base B.
Texas Go Math Grade 7 Unit 5 Study Guide Review Answer Key 23
Use the formula.
V = B . h = 12 . 9 = 108 m3

The volume of a triangular pyramid is V = 108 m3.

Question 4.
The volume of a rectangular pyramid is 1.32 cubic inches. The height of the pyramid is 1.1 inches and the length of the base is 1.2 inches. Find the width of the base of the pyramid. (Lesson 10.1) _____
Answer:
V = 1.32 in3 The volume of a rectangular pyramid
h = 1.1 in Length of pyramid
1 = 1.2 in Length of base
w = ? Width of base

Use the formula for the volume of a pyramid to find a width of the base.
V = \(\frac{1}{3}\) . l . w . h
1.32 = \(\frac{1}{3}\) . (1.2) . w . (1.1)
1.32 = \(\frac{1}{3}\) . (1.32) . w
Texas Go Math Grade 7 Unit 5 Study Guide Review Answer Key 24
The width of the base of the pyramid is w = 3 in

Mathematics Grade 7 Unit 5 Test Study Guide Answer Key Question 5.
The volume of a triangular prism is 264 cubic feet. The area of the base of the prism is 48 square feet. Find the height of the prism.
(Lesson 10.2) ____
Answer:
V = B . h
B = 48 ft2 Base of prism
h =? Height of a prism
V = 264 ft3 The volume of a prism
Use the formula for the volume of a prism to find the height of the prism.
V = B . h
264 = 48 . h
Divide both sides by 48.
Texas Go Math Grade 7 Unit 5 Study Guide Review Answer Key 25
The height of the prism is h = 5.5 ft.

Texas Go Math Grade 7 Unit 5 Performance Tasks Answer Key

Question 1.
Careers In Math Product Design Engineer Miranda is a product design engineer working for a sporting goods company. She designs a tent in the shape of a triangular prism. The dimensions of the tent are shown in the diagram.
Texas Go Math Grade 7 Unit 5 Study Guide Review Answer Key 12

a. Draw a net of the triangular prism and label the dimensions.
Texas Go Math Grade 7 Unit 5 Study Guide Review Answer Key 13
Answer:
The net of the given tent is a triangular prism.
Texas Go Math Grade 7 Unit 5 Study Guide Review Answer Key 26

b. How many square feet of material does Miranda need to make the tent (including the floor)? Show your work.
Answer:
Determine the surface area of the tent or the triangular prism:
SA = 3R + 2T
SA = 3(9.5 .8) + 2 (\(\frac{4 \cdot 6}{2}\))
SA = 3(76) + 2(12)
SA = 228 + 24
SA = 252 ft2

c. What is the volume of the tent? Show your work.
Answer:
Determine the volume of the tent or triangular prism.
V = B . h
= \(\frac{4 \cdot 6}{2}\) . 5
= 12 . 9.5
= 114 ft3

d. Suppose Miranda wants to increase the volume of the tent by 10%. The specifications for the height (6 feet) and the width (8 feet) must stay the same. How can Miranda meet this new requirement? Explain.
Answer:
The new volume of the tent is:
1.1V = 1.1 . 114 = 125.4 ft3.
The length of the tent, or the height of the prism h is the parameter being changed, so:
V = B . h
Texas Go Math Grade 7 Unit 5 Study Guide Review Answer Key 27
The tent will get longer by 10.45 – 9.5 = 0.95 ft.

Grade 7 Maths Geometry Unit 5 Test Answer Key Question 2.
Li is making a stand to display a sculpture made in art class. The stand will be 45 centimeters wide, 25 centimeters long, and 1.2 meters high.

a. What is the volume of the stand? Write your answer in cubic centimeters.
Answer:
The stand is in the form of a rectangular prism, whose volume is calculated by
V = length . width . height
Since 1.2 m = 120 cm, the volume of the stand is
V = l . w . h Write the formula for the volume
V = 45. 25. 120 Substitute the values
V = 135,000 cm3 Multiply the values

b. Li needs to fill the stand with sand so that it is heavy and stable. Each piece of wood is 1 centimeter thick. The boards are put together as shown in the figure, which is not drawn to scale. How many cubic centimeters of sand does she need to fill the stand? Explain how you found your answer.
Texas Go Math Grade 7 Unit 5 Study Guide Review Answer Key 14
Answer:
Determine the volume of the interior of the stand. To obtain that we have to “remove” 2 cm from each dimension,
thus length will be 43 cm, width is 23 cm and height is 118 cm.
V = l . w . h Write the formula for the volume
V = 43 . 23 . 118 Substitute the new values
V = 116, 702 cm3 Multiply the values

Texas Go Math Grade 7 Unit 5 Mixed Review Texas Test Prep Answer Key

Selected Response

Question 1.
The dimensions of the pyramid are given in centimeters (cm). What is the volume of the pyramid?
Texas Go Math Grade 7 Unit 5 Study Guide Review Answer Key 15
(A) 222.5 cubic centimeters
(B) 330 cubic centimeters
(C) 445 cubic centimeters
(D) 990 cubic centimeters
Answer:
(B) 330 cubic centimeters

Explanation:
h = 11 cm Height of pyramid
l = 9 cm Length of base
w = 10 cm Width of base
Use the formula for the voLume of a rectangular pyramid
V = \(\frac{1}{3}\) . l . w . h
= \(\frac{1}{3}\) . 9 . 10 . 11
= \(\frac{1}{3}\) . 990
= 330 cm3
The volume of the pyramid is 330 cm3

Question 2.
The volume of a triangular pyramid is 437 cubic units. The height of the pyramid is 23 units. What is the area of the base of the pyramid?
(A) 6.3 square units
(B) 19 square units
(C) 38 square units
(D) 57 square units
Answer:
(D) 57 square units

Explanation:
Use formula for the volume of a triangular pyramid.
B = ? Base of pyramid
h = 23units Height of a pyramid
V = 437 cubic units The volume of a pyramid
Use the formula for the volume of a pyramid to find a base area of the pyramid.
V = \(\frac{1}{3}\) . B . h
437 = \(\frac{1}{3}\) . B . 23
437 = (7.66) . B
Divide both sides by 7.66.
Texas Go Math Grade 7 Unit 5 Study Guide Review Answer Key 28
The area of the base of a pyramid is 57 square units.

Hot Tip!
Make sure you look at all the answer choices before making your decision. Try substituting each answer choice into the problem if you are unsure of the answer.

Question 3.
What is the lateral surface area of the square pyramid whose net is shown?
Texas Go Math Grade 7 Unit 5 Study Guide Review Answer Key 16
(A) 216 square feet
(B) 388 square feet
(C) 568 square feet
(D) 776 square feet
Answer:
(A) 216 square feet

Explanation:
Lateral surface area of square pyramid will be the sum of areas of all the triangles except base in the given figure.
Base of the triangle = 12 ft
Height of the triangle = 9 ft
We know that area of the rectangle is = \(\frac{1}{2}\) × Base × Height
Area of triangle = \(\frac{1}{2}\) × 12 × 9
= 54 ft2
Lateral surface area of pyramid = 4 × Area of triangle
= 4 × 54
= 216 ft2
Hence, lateral surface area is 216 ft2 and option A is correct answer

Question 4.
A one-topping pizza costs $15.00. Each additional topping costs $1.25. Let x be the number of additional toppings. You have $20 to spend. Which equation can you solve to find the number of additional toppings you can get on your pizza?
(A) 15x + 1.25 = 20
(B) 1.25x + 15 = 20
(C) 15x – 1.25 = 20
(D) 1.25x – 15 = 20
Answer:
(B) 1.25x + 15 = 20

Explanation:
Given the cost of one-topping pizza = $13.00
The cost of additional topping on pizza = $1.25
It is given we have to spend only $20 on pizza. For “x” the number of additional topping cost will be 1.25 × x and the cost of one topping pizza will be $13. So the total cost of pizza will be the sum of cost. of one-topping pizza and the additional topping cost which will be equal to $20.
In form of equation: 1.25x + 15 = 20
Hence, option B is the correct answer.

Unit 5 Test Study Guide Geometry Basics Answer Key Question 5.
A bank offers a home improvement loan with simple interest at an annual rate of 12%. J.T. borrows $ 14,000 over a period of 3 years. How much will he pay back altogether?
(A) $15,680
(B) $17,360
(C) $19,040
(D) $20,720
Answer:
(C) $19,040

Explanation:
The principal amount of home loan (P) = $14. 000
Rate of the simple interest annually (r) = 12%
Duration for which loan is taken (t) = 3 years
We know that simple interest = \(\frac{P \times r \times t}{100}\)
Simple interest = \(\frac{14,000 \times 12 \times 3}{100}\)
= 140 × 36
= $5,040
Total which has to be paid = Principal Simple interest
= 14,000 + 5,040
= $19,040
Hence, option C is correct answer.

Question 6.
What is the volume of a triangular prism that is 75 centimeters long and that has a base with an area of 30 square centimeters?
(A) 2.5 cubic centimeters
(B) 750 cubic centimeters
(C) 1,125 cubic centimeters
(D) 2,250 cubic centimeters
Answer:
(D) 2,250 cubic centimeters

Explanation:
B = 30 cm2 Base of prism
h = 75 cm Height of a prism
Use the formula for the volume of the prism.
V = B . h
= 30 . 75
= 2250 cm3

The volume of a triangular prism is 2250 cubic centimeters.

Question 7.
The radius of the circle is given in meters. What is the circumference of the circle? Use 3.14 for π.
Texas Go Math Grade 7 Unit 5 Study Guide Review Answer Key 17
(A) 25.12 meters
(B) 50.24 meters
(C) 200.96 meters
(D) 803.84 meters
Answer:
(B) 50.24 meters

Explanation:
Given radius of the circle (r) = 8 m
We know that circumference of circle of radius “r” is = 2πr
Circumference of circle = 2π × 8
= 16π
(π = 3.14)
= 16 × 3.14
= 50.24 meters.
hence, option B is correct answer.

Question 8.
The dimensions of the figure are given in millimeters. What is the area of the two-dimensional figure?
Texas Go Math Grade 7 Unit 5 Study Guide Review Answer Key 18
(A) 39 square millimeters
(B) 169 square millimeters
(C) 208 square millimeters
(D) 247 square millimeters
Answer:
(C) 208 square millimeters

Explanation:
The area of the two-dimensional figure has one 13mm. by 13 mm. square and one triangle with length of 13 mm. and height of 6 mm.
The area of the two-dimensional figure is:
(13 . 13) + (\(\frac{1}{2}\) . 13 . 6) = 169 + 39 = 208 mm2

The area of the two-dimensional figure is 208 square millimeters.

Gridded Response

Question 9.
What is the measure in degrees of an angle that is supplementary to a 74° angle?
Texas Go Math Grade 7 Unit 5 Study Guide Review Answer Key 19
Answer:
Supplementary angle : supplementary angle means the pair of angle whose sum is 180°.
Given angle in problem: = 74°
Let the other supplementary angle be = x°
x° + 74° = 180°
x = 180° – 74°
r = 106°
Hence, other supplementary angle wilt be 106°
Steps to plot the given box are:
In 1st column : mark ‘+’ sign
In 2nd column : mark “0”
In 3rd column : mark “1”
In 4th column : mark “0”
In 5th column : mark “6”
In 6th column: mark “0”
In 7th column : mark “0”
106°

Question 10.
What is the volume in cubic centimeters of a rectangular prism that has a length of 6.2 centimeters, a width of 3.5 centimeters, and a height of 10 centimeters?
Texas Go Math Grade 7 Unit 5 Study Guide Review Answer Key 20
Answer:
Given length of the rectangular prism = 6.2 cm
Given width of the rectangular prism = 3.5 cm
Given height of the rectangular prism = 10 cm
Volume of rectangular prism = length × width × height
Volume of rectangular prism = 6.2 × 3.5 × 10
= 6.2 × 35
= 217 cm3
Hence, volume of the rectangular prism is 217 cm3.

Steps to plot the given box are:
In 1st column : mark ‘+’ sign
In 2nd column : mark “0”
In 3rd column : mark “2”
In 4th column : mark “1”
In 5th column : mark “7”
In 6th column: mark “0”
In 7th column : mark “0”
volume of the rectangular prism is 217 cm3.

Hot Tip!
It is helpful to draw or redraw a figure. Answers to geometry problems may become clearer as you redraw the figure.

Geometry Unit 5 Review Answer Key Grade 7 Question 11.
What is the area of the circle in square meters? Use 3.14 for π.
Texas Go Math Grade 7 Unit 5 Study Guide Review Answer Key 21
Answer:
Given diameter of the circle (D) = 18 m
We know that area of circle of diameter “D” is = \(\frac{\pi D^{2}}{4}\)
Texas Go Math Grade 7 Unit 5 Study Guide Review Answer Key 29
hence, option B is the correct answer.

Steps to plot the given box are:
In 1st column : mark ‘+’ sign
In 2nd column : mark “0”
In 3rd column : mark “2”
In 4th column : mark “5”
In 5th column : mark “4”
In 6th column: mark “3”
In 7th column : mark “4”
Area of circle is 254.34 m2

Texas Go Math Grade 7 Unit 5 Vocabulary Preview Answer Key

Use the puzzle to preview key vocabulary from this unit. Unscramble the circled letters to answer the riddle at the bottom of the page.

Question 1.
NEONGTURC LANSEG
Texas Go Math Grade 7 Unit 5 Study Guide Review Answer Key 30
Answer:

Question 2.
LEOTECRAYMPMN SEGLAN
Texas Go Math Grade 7 Unit 5 Study Guide Review Answer Key 31
Answer:

Question 3.
RIMEUCEEFNRCC
Texas Go Math Grade 7 Unit 5 Study Guide Review Answer Key 32
Answer:

Question 4.
LEARATL ERAA
Texas Go Math Grade 7 Unit 5 Study Guide Review Answer Key 33
Answer:

Question 5.
PIECOTMOS GUISEFR
Texas Go Math Grade 7 Unit 5 Study Guide Review Answer Key 34
Answer:

1. Angles that have the same measure. (Lesson 9.1) .
2. Two angles whose measures have a sum of 90 degrees. (Lesson 9.1)
3. The distance around a circle. (Lesson 9.4)
4. The sum of the areas of the lateral faces of a prism. (Lesson 10.3) .
5. A two-dimensional figure made from two or more geometric figures. (Lesson 9.4)

Q: What do you say when you see an empty parrot cage?
A: __ __ __ ___ __ __ ___ !

Texas Go Math Grade 7 Unit 5 Study Guide Review Answer Key Read More »

Texas Go Math Grade 7 Lesson 11.1 Answer Key Analyzing Categorical Data

Refer to our Texas Go Math Grade 7 Answer Key Pdf to score good marks in the exams. Test yourself by practicing the problems from Texas Go Math Grade 7 Lesson 11.1 Answer Key Analyzing Categorical Data.

Texas Go Math Grade 7 Lesson 11.1 Answer Key Analyzing Categorical Data

Texas Go Math Grade 7 Lesson 11.1 Explore Activity Answer Key  

Solving Problems Involving Bar Graphs

The students in a class were surveyed to find out how many people live in their households. Household members might include parents, step parents, guardians, and siblings, as well as extended family, such as grandparents. The results of the survey are shown in the dot plot.
Texas Go Math Grade 7 Lesson 11.1 Answer Key 1
Texas Go Math Grade 7 Lesson 11.1 Answer Key 2

A. How many students were surveyed? How do you know?

B. What percent of the class has a household of 3 or fewer people?
Texas Go Math Grade 7 Lesson 11.1 Answer Key 3

Reflect

Go Math Lesson 11.1 Analyzing Categorical Data 7th Grade Question 1.
Critical Thinking What percent of households with 4 or fewer people have exactly 2 people?
Answer:
Total number family with 4 or fewer people = 15
Number of families with exactly two people = 3
Texas Go Math Grade 7 Lesson 11.1 Answer Key 14
Hence, 20% of family have exactly 2 people among family having 4 or fewer people.

Example 1.
Three boys and three girls ran for 7th grade class president. The boys are Andrew, Derrick, and Miguel. The girls are Becky, Dora, and Trisha. The results of the election are shown in the bar graph. Which is greater – the percent of total votes for boys that Derrick received, or the percent of total votes for girls that Dora received?
Texas Go Math Grade 7 Lesson 11.1 Answer Key 4
Step 1:
Calculate the percent of total votes for boys that Derrick received. Set up a ratio:
Texas Go Math Grade 7 Lesson 11.1 Answer Key 5
Derrick received 45% of the total votes for boys.
Step 2:
Calculate the percent of total votes for girls that Dora received. Set up a ratio:
Texas Go Math Grade 7 Lesson 11.1 Answer Key 6
Dora received 40% of the total votes for girls.
Step 3
Compare the percents calculated in the previous two steps.
Because 45% is greater than 40%, the percent of votes for boys that Derrick received is greater.

Your Turn

Question 2.
In Example 1, Calculate the percent of total votes that Dora received.
Answer:
Calculate the percent of total votes that Dora received.
Texas Go Math Grade 7 Lesson 11.1 Answer Key 15
Dora received 22.2% of the total votes for all canditates.

Example 2.
There are 5,000 tickets available for a concert. The percent of available tickets belonging to each ticket type is shown in the circle graph. Calculate the number of tickets available for each type of ticket.
Texas Go Math Grade 7 Lesson 11.1 Answer Key 7
Step 1
Write a ratio to represent each type of ticket.
Floor: 16% = \(\frac{16}{100}\)
Lower level: 30% = \(\frac{30}{100}\)
Platinum: 2% = \(\frac{2}{100}\)
Upper level: 44% = \(\frac{44}{100}\)
Club: 8% = \(\frac{8}{100}\)
Step 2:
Set up and solve a proportion to find the number of each type of ticket.
Texas Go Math Grade 7 Lesson 11.1 Answer Key 8
The floor has 800 tickets, the lower level has 1,500, the upper level has 2,200, the club has 400, and the platinum section has 100.

Your Turn

Texas Go Math Grade 7 Practice and Homework Lesson 11.1 Answer Key Question 3.
What percentage of sold tickets not on the floor were platinum tickets? Round to the nearest percent.
Answer:
Total number of tickets for concert = 5,000
Number of Platinum tickets = 100
Number of tickets on floor = 800
Number of non-floor ticket = 5,000 – 800 = 4,200
% of platinum ticket which are not on floor = \(\frac{100}{4200}\) × 100
= \(\frac{100}{42}\)
= 2.38%
Hence, 2.38% of non-floor tickets were platinum tickets.

Texas Go Math Grade 7 Lesson 11.1 Guided Practice Answer Key

Question 1.
The students in the class were asked which hand they preferred to use for writing. The bar graph shows the results. Of the students who had a preference, what percent chose the left hand? (Example 1)
Texas Go Math Grade 7 Lesson 11.1 Answer Key 9
Step 1
Find the total number of students who had a preference.
Left ___ Right ___ Total ____
Step 2:
Set up a proportion and find the percent.
________
Answer:
Left = 6
Right = 18
Total = 6 + 18 = 24
Texas Go Math Grade 7 Lesson 11.1 Answer Key 16
Hence, 25% of students have left hand as preference.

Question 2.
There are 20,000 members of a zoo. The percent of members having each membership type is shown in the circle graph. How many members have a contributor membership? What percentage of the noncontributory memberships are individual memberships? Round to the nearest percent. (Example 2)
Texas Go Math Grade 7 Lesson 11.1 Answer Key 10
Answer:
Total number of membership of zoo = 20,000
Percentage of contributor membership = 7.5%
Percentage of individual membership = 60%
Number member with contributor membership = \(\frac{7.5}{100}\) × 20,000
= 0.075 × 20,000
= 1500
Number member with individual membership = \(\frac{60}{100}\) × 20,000
= 0.6 × 20,000
= 12,000
Number of noncontributory membership = 20,000 – 1500 = 18,500
Percent of noncontributory who are individual = \(\frac{12000}{18500}\) × 100
= 0.6486 × 100
= 64.86%

Essential Question Check-In

Analyzing Categorical Data Worksheet Go Math 11.1 7th Grade Question 3.
When solving proportions based on data from graphs, why do you often convert from fractions and percents to decimals?
Answer:
When solving proportions based on data from graphs, we do often convert from fractions and percents to decimals because decimals are way to represent the fraction and percentage. When the fraction are calculated further we get decimal values and when it is multiplied by 100 we get the values in percentage (%)
Thus it helps in simplifying the calculation of problems.

Decimals helps in simplifying the calculation of problems.

Texas Go Math Grade 7 Lesson 11.1 Independent Practice Answer Key

The number of computers sold at an electronics store for each day of a week is shown in the dot plot.

Question 4.
What percent of all computers sold during the entire week were sold on Friday?
Answer:
The number of computers sold in each day in week:
Monday: 6
Tuesday: 9
Wednesday: 5
Thursday: 8
Friday: 12
Saturday: 7
Sunday: 3
Total of sold computers is 50.
Set up a proportion:
Texas Go Math Grade 7 Lesson 11.1 Answer Key 17
To find a percent of sold computers in friday, divide x by 100. Add a “%“ sign.
\(\frac{x}{100}\) = \(\frac{24}{100}\) = 0.24%
The percent of all computers sold in Friday is 0.24%

Question 5.
What percent of computers sold on weekdays were sold on Tuesday? Round to the nearest percent.
Answer:
Total of sold computers is 50.
The number of sold computers on Tuesday is 9.
Set up a proportion:
Texas Go Math Grade 7 Lesson 11.1 Answer Key 18
To find a percent of sold computers on Tuesday, divide x = 18 by 100 Add a “%“ Sign.
\(\frac{x}{100}\) = \(\frac{18}{100}\) = 0.18 ≈ 0.2%

A percent of sold computers on Tuesday is 0.2%.

Texas Go Math Grade 7 Lesson 11.1 Answer Key 11

Question 6.
Multiple Representations Suppose the data described above for the electronics store were represented with a bar graph instead of a dot plot. Would there be any advantages or disadvantages?
Answer:
Both bar graphs and dot plot have their own advantages and disadvantages depending on the person who uses it Both a bar graph and a dot plot are easier to interpret since the data are easily laid out However, for some,
they prefer a bar graph over a dot plot because in a bar graph, the actual numbers can be shown (the y-axis of the
graph) unlike in the dot plot where you just count the dots in order to determine the result.

Both bar graphs and dot plot have their own advantages and disadvantages depending on the person who uses it.

The number of states in the United States that are primarily in each of the time zones is shown in the bar graph.

Texas Go Math Grade 7 Answer Key Pdf Categorical Data Worksheet Question 7.
The continental United States is all states except Hawaii and Alaska. What percent of the continental states are primarily in the Eastern time zone?
Answer:
Calculate the percent of total continental states which are primarily in the Eastern time zone.
Texas Go Math Grade 7 Lesson 11.1 Answer Key 19

The percent of the continental states in the Eastern time zone is 43.68 %.

Texas Go Math Grade 7 Lesson 11.1 Answer Key 12

Question 8.
Is the percent of the continental states primarily in the Eastern time zone greater than or less than the percent of
all states that are in the Mountain or Central time zone?
Answer:
Calculate the percent of total continental states which are primarily in the Mountain and Central zone.
Texas Go Math Grade 7 Lesson 11.1 Answer Key 20

In percent of the continental states in the Eastern time zone is less than the percent of all continental states that are in the Mountain and Central time zone.

Question 9.
What If? Suppose the horizontal scale of the bar graph had intervals of 1 instead of 4. Would there be any advantages to having that scale? Would there be any disadvantages?
Answer:
The spread of the dot plots are:

  • The data is almost equally distributed on both the side of centre which is “6”
  • All the data is between 3 to 9
  • Range of the given dot plot: 9 – 3 = 6

Range of given dot plot is 6

All of the boys attending a prom wore a tuxedo. The circle graph shows the number of boys wearing each of the different bow tie colors.

Question 10.
Make a Conjecture Estimate the percent of boys wearing black bow ties by comparing the black section of the graph to the whole graph.
Answer:
Calculate the percent of boys wearing black bow ties.
Boys wearing black bow ties 66 66
Texas Go Math Grade 7 Lesson 11.1 Answer Key 21

The percent of boys wearing black bow ties is 33 %.

Texas Go Math Grade 7 Lesson 11.1 Answer Key 13

Analyzing Data Worksheet Answer Key Lesson 11.1 Answer Key 7th Grade Question 11.
Calculate the percentage of boys wearing each bow tie color. How does the percentage of wearing black bow ties compare to your estimate?
Answer:
Calculate the percentage of boys wearing grey bow ties.
Texas Go Math Grade 7 Lesson 11.1 Answer Key 22
Calculate the percent of boys wearing white bow ties.
Texas Go Math Grade 7 Lesson 11.1 Answer Key 23

Calculate the percent of boys wearing blue bow ties.
Texas Go Math Grade 7 Lesson 11.1 Answer Key 24
Calculate the percent of boys wearing red bow ties.
Texas Go Math Grade 7 Lesson 11.1 Answer Key 25

Calculate the percent of boys wearing green bow ties.
Texas Go Math Grade 7 Lesson 11.1 Answer Key 26
Calculate the percent of boys wearing purple bow ties.
Texas Go Math Grade 7 Lesson 11.1 Answer Key 27

Grey bow ties: 12.5 %
White bow ties: 24 %
Blue bow ties: 11 %
Red bow ties: 9 %
Green bow ties: 65 %
Purple bow ties: 4 %
The percent of black bow ties is bigger than the percent of bow ties in others colors.

H.O.T. Focus on Higher Order Thinking

Question 12.
Communicate Mathematical Ideas A dot plot shows the number of pizzas sold at a local restaurant each day one week. One column of dots on the plot is much taller than the others. Explain what that means in the context of the data and of percents. Then describe how that same category would be noticeable on a circle graph of the same data.
Answer:
If one column of dots on the plot is much taller than the others column this means on that particular day of week
number of pizza sold at local restaurant is maximum as compared to the other days of week. So in a week the local restaurant sell heighest number of pizza on day that. Also in terms of percentage maximum percentage of pizza is sold on that day.

If same data is plotted on the circle graph than that particular day will have maximum area on the circle and the circle will be dividend in the number of days.

If one column of dots on the plot is much taller than the others column this means on that particular day of week number of pizza sold at local restaurant is maximum.

Question 13.
Analyze Relationships What is the relationship between the degree measure of the angle formed by the straight edges of a section of a circle graph and the percent of the data that the section represents?
Answer:
The relationship between the degree measure of the angle formed by the straight edges of a section of a circle
graph and the percentage of the data that the section represents are that both are directly proportional. If the
percentage of data is maximum then the angle formed in circle will be also maximum and if percentage of data is
minimum then the angle formed by circle will be also minimum.
Relation between angle of circle and percents of data is:
⇒ 100% = 360°
⇒ 1% = \(\frac{360^{\circ}}{100}\)
⇒ 1% = 3.6°

1% of data is equal to 3.6° on circle.

Question 14.
Multiple Representations A bar graph has 8 bars, all the same height. Suppose that a circle graph were used instead of a bar graph to represent the data. What percent ofthe data would each piece represent?
Answer:
It is given in the problem that there are 8 bars on bar graph and of equal height. So each bar will represent equal
percentage of the data. Hence in circle graph the circle will be divided in 8 equal parts and each single part will represent a bar of bar graph. We know that a complete circle is of 360°, so the single part of circle will \(\frac{360}{8}\) = 45°
Now finding each part of data (45°) in percentage:
360° = 100%
1° = \(\frac{100}{360} \%\)
So, 45° = \(\frac{100}{360}\) × 45%
= 12.50%
Hence, each piece wilt represent 12.50% of data.

Texas Go Math Grade 7 Lesson 11.1 Answer Key 28

Each piece will represent 12.50% of data.

Texas Go Math Grade 7 Lesson 11.1 Answer Key Analyzing Categorical Data Read More »

Texas Go Math Grade 7 Lesson 12.1 Answer Key Populations and Samples

Refer to our Texas Go Math Grade 7 Answer Key Pdf to score good marks in the exams. Test yourself by practicing the problems from Texas Go Math Grade 7 Lesson 12.1 Answer Key Populations and Samples.

Texas Go Math Grade 7 Lesson 12.1 Answer Key Populations and Samples

Texas Go Math Grade 7 Lesson 12.1 Explore Activity Answer Key  

Random and Non-Random Sampling

When information is being gathered about a group, the entire group of objects, individuals, or events is called the population. A sample is part of the population that is chosen to represent the entire group.

A vegetable garden has 36 tomato plants arranged in a 6-by-6 array. The gardener wants to know the average number of tomatoes on the plants. Each white cell in the table represents a plant. The number in the cell tells how many tomatoes are on that particular plant.

Because counting the number of tomatoes on all of the plants is too time-consuming, the gardener decides to choose plants at random to find the average number of tomatoes on them.

To simulate the random selection, roll two number cubes 10 times. Find the cell in the table identified by the first and second number cubes. Record the number in each randomly selected cell.

Texas Go Math Grade 7 Lesson 12.1 Answer Key Populations and Samples 1

A. What is the average number of tomatoes on the 10 plants that were randomly selected?

B. Alternately, the gardener decides to choose the plants in the first row. What is the average number of tomatoes on these plants?

Reflect

Question 1.
How do the averages you got with each sampling method compare to the average for the entire population, which is 28.25?
Answer:
The averages obtained by both sampling methods are around the actual average of 28.5; the first method generated an average of 29.5 while the second method was 20.5.

Seventh Grade Answer Key Lesson 12.1 Texas Go Math Question 2.
Why might the first method give a closer average than the second method?
Answer:
The averages obtained by both sampling methods are around the actual average of 28.5; the first method generated an average of 29.5 while the second method generated 20.5. The first method’s average is closer to the actual average because it is more distributed and more random, unlike the second method.

The first method’s average is closer to the actual average because it is more distributed and more random, unlike the second method.

Reflect

Question 3.
You want to know the preferred practice day of all the players in a soccer league. How might you select a random sample?
Answer:
For example, you could survey one player from each soccer team.

Your Turn

Determine whether each sample is a random or biased sample. Explain your reasoning.

Question 4.
A librarian randomly chooses 100 books from the library’s database to calculate the average length of a library book.
Answer:
This is a random sample because each book, with different length, has an equal chance of being selected.

This is a random sample.

In Madison County, residents were surveyed about a new skateboard park. Determine whether each survey question may be biased. Explain.

Texas Go Math Grade 7 Lesson 12.1 Answer Key Populations and Samples 2

A. Would you like to waste the taxpayers’ money to build a frivolous skateboard park?
This question is biased. It discourages residents from saying yes to a new skateboard park by implying it is a waste of money.

B. Do you favor a new skateboard park?
This question is not biased. It does not include an opinion on the skateboard park.

C. Studies have shown that having a safe place to go keeps kids out of trouble. Would you like to invest taxpayers’ money to build a skateboard park?
This question is biased. It leads people to say yes because it mentions having a safe place for kids to go and to stay out of trouble.

Your Turn

Determine whether each question may be biased. Explain.

Texas Go Math Grade 7 Lesson 12.1 Answer Key Question 5.
When it comes to pets, do you prefer cats?
Answer:
Yes, given question will be biased.
Because in given question name of the pet (cats) is already mentioned. So every pets will not have equal chance of being selected. And the answer for the asked question in the problem will be mostly in Yes or No.

Yes, given question will be biased

Question 6.
What is your favorite season?
Answer:
No, given question will not be biased.
Because in given question name of any season is not mentioned So every season will, have equal chance of being
selected. And the answer for the asked question in problem will the name of favourite season.

No, given question will not be biased.

Texas Go Math Grade 7 Lesson 12.1 Guided Practice Answer Key  

Question 1.
Follow each method described below to collect data to estimate the average shoe size of seventh grade boys. (Explore Activity)

Method 1

A. Randomly select 6 seventh grade boys and ask each his shoe size. Record your results in a table like the one shown.
Answer:
Texas Go Math Grade 7 Lesson 12.1 Answer Key Populations and Samples 4

B. Find the mean of this data. Mean:
Answer:
Texas Go Math Grade 7 Lesson 12.1 Answer Key Populations and Samples 5
Hence, the mean of shoe size of randomly selected student is 6.16

Method 2

A. Find the 6 boys in your math class with the largest shoes and ask their shoe size. Record your results in a table like the one shown in Method 1.
Answer:
Sample of six boys with largest shoes in my math class are:
Texas Go Math Grade 7 Lesson 12.1 Answer Key Populations and Samples 6

B. Find the mean of this data. Mean: ____
Answer:
Texas Go Math Grade 7 Lesson 12.1 Answer Key Populations and Samples 7
Hence, the mean shoe size of students is 8.33

Texas Go Math Grade 7 Populations and Samples Answer Key Question 2.
Method 1 produces results that are more/less representative of the entire student population because it is a random/biased sample. (Example 1)
Answer:
Method 1 produces results that are more representative of the entire student population because it is a random
sample.

Question 3.
Method 2 produces results that are more/less representative of the entire student population because it is a random/biased sample. (Example 1)
Answer:
Method 2 produces results that are less representative of the entire student population because it is a biased sample.

Question 4.
Heidi decides to use a random sample to determine her classmates’ favorite color. She asks, “Is green your favorite color?” Is Heidi’s question biased? If so, give an example of an unbiased question that would serve Heidi better. (Example 2)
Answer:
Yes, Heidi’s question is biased.
Because when Heidi is asking question she is particularly mentioning green colour so, here the sample (favourite colour of classmate) is not random. As soon as Heidi mention the green colour in her question the sample becomes the biased sample which means the outcome from her classmates will be in Yes or No.
Example of unbiased question that Heidi can ask from her classmate will be : Which is your favourite color?

Essential Question Check-In

Question 5.
Flow can you select a sample so that the information gained represents the entire population?
Answer:
When the sample are selected randomly from the entire groups or individual (which known as population) then the information gained represents the entire population.

Texas Go Math Grade 7 Lesson 12.1 Independent Practice Answer Key 

Question 6.
Paul and his friends average their test grades and find that the average is 95. The teacher announces that the average grade of all of her classes is 83. Why are the averages so different?
Answer:
The average of Paul and his friend (95) is different from the average announced by teacher (83) because when Paul is finding the average he is taking the biased sample. While finding the average Paul is considering only his and friends marks in test But in case of teacher while finding the average, teacher is taking random sample as teacher is considering the marks of each student in class while.

Paul is taking biased sample while teacher is taking random sample

Texas Go Math Book 7th Grade Answer Key Lesson 12.1 Question 7.
Nancy hears a report that the average price of gasoline is $2.82. She averages the’ prices of stations near her home. She finds the average price of gas to be $3.03. Why are the averages different?
Answer:
There is a difference in the average price of gasoline from the report ($2.82) and the gasoline price found by Nancy ($33.03) because when Nancy is finding the price she is considering the price of gasoline which is near to her home thus taking only biased sample in her calculation. But in case of price of report the calculation are done while taking the sample from everywhere which means the sample are taken randomly.

Nancy is taking biased sample but in case of report sample are taken randomly.

For 8-11, determine whether each sample is a random sample or a biased sample. Explain.

Question 8.
Carol wants to find out the favorite foods of students at her middle school. She asks the boys’ basketball team about their favorite foods.
Answer:
The sample will be biased sample
Because carol wants to know the favourite foods of students at middle school but she asks about it only with the basketball team out of whole middle school. So the population here is only the members of basketball team.

Question 9.
Dallas wants to know what elective subjects the students at his school like best. He surveys students who are leaving band class.
Answer:
The sample will be biased sample
Because Dallas wants to know the elective subjects of students which they liked best but she asks about it only with the students who are leaving band class. So the population here is only the students who are leaving the band class.

Question 10.
Karim wants to know what day of the week students at his school prefer. He randomly asks students each day in the cafeteria.
Answer:
The sample will be random sample
Because Karim wants to know the day of week which students prefer at his school and asks about it with the random students each day in cafeteria. So the population here is all the students of the school.

Question 11.
Members of a polling organization survey 700 registered voters by randomly choosing names from a list of all registered voters.
Answer:
The sample will be random sample
Because members of the potting organisation is surveying 700 registered voters by randomly and choosing the names from the list of registered voters. So the population here is all the 700 registered voters.

Determine whether each question may be biased. Explain.

Texas Go Math Grade 7 Pdf Population and Samples Answer Key Question 12.
Joey wants to find out what sport seventh-grade girls like most. He asks girls, “Is basketball your favorite sport?”
Answer:
Yes the question asked by Joey is biased.
Because joey while asking from seventh-grade girls that which sports do they Like, Joey mentions the name of basketball. So the population will be all the girls who like or not the basketball sports because they will reply in Yes or No. when this question will be asked the girls will not reply about their favourite sports.

Question 13.
Jae wants to find out what type of art her fellow students enjoy most. She asks her classmates, “What is your favorite type of art?”
Answer:
No, the question asked by Jae is not biased.
Because Jae has randomly asked from the fellow students about the art which enjoy the most So the population is all the fellow students of Jae.

Texas Go Math Grade 7 Lesson 12.1 H.O.T. Focus on Higher Order Thinking Answer Key 

Question 14.
Draw Conclusions Determine which sampling method will better represent the entire population. Justify your answer.
Texas Go Math Grade 7 Lesson 12.1 Answer Key Populations and Samples 3
Answer:
The first sampling method in which Collin surveys 78 students randomly will better represent the entire population. The reasons for this are mentioned below :

  • In case of Collin, surveys are being done on 78 students as compared to in the case of Karl where the survey is done only on 25 students. So larger number of samples will represent entire population the most.
  • In case of Collin surveys sample are chosen randomly as compared to Karl’s survey where samples are chosen who are near hint during lunch.

Collin survey will better represent the entire population.

Practice and Homework Lesson 12.1 Answer Key 7th Grade Question 15.
Multistep Barbara surveyed students in her school by looking at an alphabetical list of 600 student names, dividing them into groups of 10, and randomly choosing one from each group.

a. How many students did she survey? What type of sample is this?
Answer:
Since there are 600 student names and they are divided into 10 groups, the number of students that were surveyed:
600 ÷ 10 = 60
Barbara surveyed 60 students
The sample done is called a random sample. A random sample is giving an equal chance of being selected.

b. Barbara found that 35 of the survey participants had pets. About what percent of the students she surveyed had pets? Is it safe to believe that about the same percent of students in the school have pets? Explain your thinking.
Answer:
The percent of the students that have pets from the 60 participants iS:
\(\frac{35}{60}\) × 100% ≈ 58%
The percentage of students having pets is somewhat reasonable as the basis for the same percentage of students in the school who have pets. This is because of the random sample and the result is a significant percentage of the students which is more than half of the surveyed participants.

Go Math Grade 7 Lesson 12.1 Answer Key Question 16.
Communicating Mathematical Ideas Carlo said a population can have more than one sample associated with it. Do you agree or disagree with his statement? Justify your answer.
Answer:
Basically, a population needs to have one sample. This sample is a part of the population that is chosen to represent the entire group (population). For some, they prefer random sampling, as this gives an equal chance of being selected from the population. However, there is also called a biased sample, in which the sample does not accurately represent the population. So the statement of Carlo really depends on how the sampling will take place and the survey question. For example, the population is a Math Club. The sample could be random or biased depending on the survey question and the manner of choosing the sample. For the question, it will be biased when you would ask, what is their favorite subject? It is very obvious that most of the sample will answer Math because the population is from the Math Club. It could be a random sample even when you randomly pick the participant and have a different question not related to being in a Math Club.

It depends on the survey question and population.

Texas Go Math Grade 7 Lesson 12.1 Answer Key Populations and Samples Read More »

Texas Go Math Grade 7 Lesson 10.2 Answer Key Volume of Triangular Prisms and Pyramids

Refer to our Texas Go Math Grade 7 Answer Key Pdf to score good marks in the exams. Test yourself by practicing the problems from Texas Go Math Grade 7 Lesson 10.2 Answer Key Volume of Triangular Prisms and Pyramids.

Texas Go Math Grade 7 Lesson 10.2 Answer Key Volume of Triangular Prisms and Pyramids

Essential Question
How do you find the volume of a triangular prism or a triangular pyramid?

Finding the Volume of a Triangular Prism
The volume V of a prism is the area of its base B times its height h, or V = Bh .

Example 1
Find the volume of the triangular prism.
Step 1
Find the area of the triangular base.
Texas Go Math Grade 7 Lesson 10.2 Answer Key 1
Texas Go Math Grade 7 Lesson 10.2 Answer Key 2

Step 2
Find the volume of the triangular prism.
Texas Go Math Grade 7 Lesson 10.2 Answer Key 3

Reflect

Question 1.
What If? Suppose you know the volume V and base area B of a triangular prism. How could you find the height of the prism?
Answer:
raggedright The volume of a triangular prism is:
V = B . h (1)
We know the area of the base B and the volume of a triangular prism.
Divide (1) by B.
Texas Go Math Grade 7 Lesson 10.2 Answer Key 19

Your Turn

Lesson 10.2 Volume of a Triangular Prism Formula 7th Grade Question 2.
Find the volume of a garden seat in the shape of a triangular prism with a height of 30 inches and a base area of 72 in2.
Answer:
V = B . h
We know the base B and the height of a prism.
B = 72 in2
h = 30 in
Substitute vaWe of base and height of a prism.
V = 72 . 30
= 2160 in3

The volume of a garden seat is 2160 in3.

Texas Go Math Grade 7 Lesson 10.2 Explore Activity Answer Key  

Exploring the Volume of a Triangular Pyramid

Previously you explored the volumes of rectangular prisms and pyramids. Now you will repeat the same activity with triangular pyramids and prisms that have the same height and congruent bases.

Step 1
Make three-dimensional models. Make larger versions of the nets shown. Make sure the bases and heights in each net are the same size. Fold each net, and tape it together to form an open prism or pyramid.
Texas Go Math Grade 7 Lesson 10.2 Answer Key 4

Step 2
Fill the pyramid with bears. Make sure that the beans are level with the opening of the pyramid. How many pyramids full of beans do you think
it will take to fill the prism? ________________________
Pour the beans into the prism. Repeat until the prism is full.
Was your conjecture supported?
Texas Go Math Grade 7 Lesson 10.2 Answer Key 5

Step 3
Write a fraction that compares the volume of the pyramid to the volume of the prism.

Reflect

Question 3.
Analyze Relationships Does it appear that the relationship between the volume of triangular pyramids and prisms is the same as that for rectangular pyramids and prisms?
Answer:
The volume of the triangular pyramids and prisms with congruent bases and heights is the same as how the
volume of rectangular pyramids and prisms are determined. The relationship between the two is the same in
which the volume of the triangular pyramid is \(\frac{1}{3}\) the volume of the triangular prism.

Yes

Lesson 10.2 Answer Key Volume of Prisms and Cylinders Answers Question 4.
Draw Conclusions Write a formula for the volume of a triangular pyramid with a base area of B and a height of h.
Answer:
We know that the volume V of a triangular pyramid is the area of its base B times its one-third of height h.
Formula for volume = \(\frac{1}{3}\)Bh
where, B is area of base and h is height of triangular pyramid.

V = \(\frac{1}{3}\)Bh

Your Turn

Question 5.
The volume of a triangular pyramid is 13.5 m3. What is the volume of a triangular prism with a congruent base and the same height? Explain.
Answer:
ragged right The volume of a triangular prism is
V = B . h (1)
The volume of triangular pyramid is
VP = \(\frac{1}{3}\)B . h (2)
They have same value for base and height.
Multiply (2) by 3
3VP = B . h = V
The volume of a triangular prism is three time as big as the volume of a pyramid.
The volume of a triangular prism is:
V = 3 . VP = 3 . (13.5) = 40.5 m3
The volume of a triangular prism is three time as big as the volume of a pyramid.
The volume of a triangular prism is:
V = 3 VP = 40.5 m3

Example 2
Mr. Martinez is building wooden shapes for a sculpture in the park. His plans show a triangular pyramid and a triangular prism, and each shape is 5 feet high. The base of each shape is a triangle with a base of 2.5 feet and a height of 2 feet. How much greater than the volume of the pyramid is the volume of the prism?
Texas Go Math Grade 7 Lesson 10.2 Answer Key 6
Step 1
The triangular base is the same for both shapes. Find the area of the base B.
Texas Go Math Grade 7 Lesson 10.2 Answer Key 7
The area of the base B for both shapes is 2.5 ft2.

Step 2
Find the volume of the prism.
V = Bh Use the formula.
V = (2.5) × 5 = 12.5 Substitute the value for B and h of the prism.
The volume of the prism is 12.5 ft3.

Step 3
Find the volume of the pyramid.
Volume of pyramid = \(\frac{1}{3}\) . volume of prism
= \(\frac{1}{3}\) . 12.5 ≈ 4.2 Substitute and calculate.
The volume of the pyramid is approximately 4.2 ft3.

Step 4
Compare the volumes.
Volume of prism – volume of pyramid = 12.5 – 4.2 = 8.3
The volume of the prism is 8.3 ft3 greater than that of the pyramid.

Your Turn

Go Math Grade 7 Lesson 10.2 Answer Key Question 6.
How much greater is the volume of a triangular prism with a base area of 14 cm2 and a height of 4.8 cm than the volume of a triangular pyramid with the same height and base area?
Answer:
Use the formula for a prism.
V = B . h
B = 14 cm2 Base area of a prism
h = 4.8 cm Height of a prism
y = 14 . (4.8)
V = 67.2 cm3 The volume of a prism
Use formula for a pyramid.
V = \(\frac{1}{3}\) . B . h = \(\frac{1}{3}\) . volume of a prism
= \(\frac{1}{3}\) . (67.2)
V = 22.4
Volume of a prism – volume of a pyramid = 44.8 cm3
The volume of a prism is 44.8 cm3 greater than that of the pyramid.

Texas Go Math Grade 7 Lesson 10.2 Guided Practice Answer Key  

Question 1.
Find the volume of the triangular prism. (Example 1)
Texas Go Math Grade 7 Lesson 10.2 Answer Key 8
Find the area of the base of the prism.
Use the equation A = ______ bh.
A = ___ (___) (___) = ___ in2
Find the volume of the prism. Use the equation V = Bh.
V = (___)(___) = ___ in3
Answer:
b = 3 in Length of base
h = 3 in Height of base
h = 16 in Height of a prism
A = \(\frac{1}{2}\) . b. h
A = \(\frac{1}{2}\) . 3 . 3 = \(\frac{9}{2}\) = 4.5 in2
V = B . h
V = (4.5) . 16 = 72 in3
V = 72 in3

Question 2.
A triangular pyramid and a triangular prism have congruent bases and the same height. The triangular pyramid has a volume of 90 m3. Find the volume of the prism. (Explore Activity)
The volume of the prism is ___ because the volume of the prism is ___ times the volume of the pyramid.
Answer:
The volume of a prism is:
V = B . h
The volume of a pyramid is:
VP = \(\frac{1}{3}\) . B . h
They have congruent bases and the same height so the volume of the prism is:
Texas Go Math Grade 7 Lesson 10.2 Answer Key 20
The volume of the prism is
270 m3
because the volume of the prism is three times the volume of the pyramid.

Texas Go Math Grade 7 Volume Triangular Prism Answer Key Question 3.
In Exercise 2, how much greater is the volume of the prism than the volume of the pyramid? (Example 2)
Answer:
The volume of the pyramid is only of the volume of the prism. Since the volume of the prism is 270 m3 and the volume of the pyramid is 90 m3. The volume of the prism is greater than the volume of the pyramid by 180 m3

Find the volume of each figure.

Question 4.
Texas Go Math Grade 7 Lesson 10.2 Answer Key 9
Answer:
b = 9 ft Lenghtofthe base
H = 5 ft Height of a prism
h = 9 ft Height of the base
Find the area of the base B We have triangular base, so we use the formula:
B = \(\frac{1}{2}\) . b . h = \(\frac{1}{2}\) . 9 . 9 = \(\frac{81}{2}\) = 40.5 ft2
Use the formula for the voLume of a prism.
V = B . H= (40.5) . 5 = 202.5 ft3

V = 202.5 ft3

Question 5.
Texas Go Math Grade 7 Lesson 10.2 Answer Key 10
Answer:
l = 6ft Lenght of the base
w = 6 ft Width of the base
h = 6 ft Height of a pyramid
Find the area of the base B.
B = l . w = 6 . 6 = 36 ft2
Use tne formula.
V = \(\frac{1}{3}\) . B . h
Texas Go Math Grade 7 Lesson 10.2 Answer Key 21
V = 72 ft3

Question 6.
Texas Go Math Grade 7 Lesson 10.2 Answer Key 11
Answer:
a = 7 in The leg of a right triangle
b = 10 in The leg of a right triangle
h = 5 in Height of a prism
Find the area of the base B.
Texas Go Math Grade 7 Lesson 10.2 Answer Key 22
Use the formula.
V = B . h = 35.5 = 175 in3

V = 175 in3

Essential Question Check-In

Lesson 10.2 Volume of Prisms and Cylinders Answer Key Question 7.
A pyramid has a base that is a triangle. The length of the base of the triangle is 5 meters, and the height of the triangle is 12 meters. The height of the pyramid is 10 meters. How would you explain to a friend how to find the volume of the pyramid?
Answer:
b = 5 m Length of base
hB = 12 m Height of base
h = 16 m Height of a pyramid
Find the area of the base B. The base is in the shape of a triangle. Use the formula:
Texas Go Math Grade 7 Lesson 10.2 Answer Key 23
Use the formula for the volume of a triangular pyramid:
Texas Go Math Grade 7 Lesson 10.2 Answer Key 24
The volume of the triangular pyramid is 160 m3.

Texas Go Math Grade 7 Lesson 10.2 Independent Practice Answer Key  

Question 8.
A trap for insects is in the shape of a triangular prism. The area of the base is 3.5 in2 and the height of the prism is 5 in. What is the volume of this trap?
Answer:
A trap for insect is in the shape of triangular prism, so use the formula for the volume of a triangular prism.
B = 3.5 in2 Base of a prism
h = 5 in Height of a prism
The volume of a prism is
V = Bh = (3.5) . 5 = 17.5 in3
The volume of a trap for insect is 17.5 in3.

Question 9.
Arletta built a, cardboard ramp for her little brothers’ toy cars. Identify the shape of the ramp. Then find its volume.
Texas Go Math Grade 7 Lesson 10.2 Answer Key 12
Answer:
A cardboard ramp is in the shape of a triangular prism. Use the formula for the volume of a triangular prism.
a = 25 in Length of one side of the triangle
b = 6 in Length of other side of the triangle
h = 7 in Height of a prism
Find the area of the base B.
Texas Go Math Grade 7 Lesson 10.2 Answer Key 25
The volume of a triangular prism is:
V = B . h = 75 . 5 = 525 in3

The volume of a cardboard ramp is 525 in3.

Go Math Chapter 10 Lesson 10.2 Answer Key Question 10.
Represent Real-World Problems Sandy builds this shape of four congruent triangles using clay and toothpicks. The area of each triangle is 17.6 cm2, and the height of the shape is 5.2 cm. What three-dimensional figure does the shape Sandy built resemble? If this were a solid shape, what would be its volume? Round your answer to the nearest teñth.
Texas Go Math Grade 7 Lesson 10.2 Answer Key 13
Answer:
Sandy built a three-dimensional figure which resemble on the triangular pyramid
B = 17.6 cm2 Base of pyramid
h = 5.2 cm Height of a pyramid
Use the formula for the volume of a pyramid.
V = \(\frac{1}{3}\) . 17.6 . 5.2
= 30.50 ≈ 31 cm3

Sandy built a three-dimensional figure which resemble on the triangular pyramid.
The volume of the triangular pyramid is 31 cm3.

Question 11.
Draw Conclusions Would tripling the height of a triangular prism triple its volume? Explain.
Answer:
B = B Base area
h = h Height of a prism
Use the formula for the volume of a triangular prism.
V1 = Bh
Now triple the height of a prism.
B = B Base area
h = 3 . h Height of a prism
Use the formula for the volume of a triangular prism.
V2 = B . 3 . h = 3 (B . h) = 3 . V1

The tripling height of a triangular prism triples its volume.

Go Math Grade 7 Chapter 10 Lesson 10.2 Answer Key Question 12.
The Jacksons went camping in a state park. One of the tents they took is shown. What is the volume of the tent?
Texas Go Math Grade 7 Lesson 10.2 Answer Key 14
Answer:
b = 4.5 ft Length of base
hB = 3.5 ft Height of base
h = 6ft Height of a prism
Find the area of the base B. The tent is in the shape of a triangular prism. A prism has a base that is a triangle, so use the formula:
B = \(\frac{1}{2}\) . b . hB = \(\frac{1}{2}\)(4.5) . (3.5) = 7.875 ft2
The volume of a triangular prism is:
V = B . h = (7.875) . 6 = 47.25 ft3
The volume of the tent is 47.25 ft3.

Question 13.
Shawntelle is solving a problem involving a triangular pyramid. You hear her say that bee” is equal to 24 inches. How can you tell if she is talking about the base area B of the pyramid or about the base b of the triangle?
Answer:
Shawntelle while solving a problem she say ‘bee’ is equal to 24 inches. So she is definitely talking about the base
b of the triangle not the base area B. Because she use the unit of base as inches not inch2. If she was taking about the base area then she would have must mentioned the unit as inch2 inches of inches.
Hence, she is talking about the base b of the triangle not base area B.

Question 14.
Alex made a sketch for a homemade soccer goal he plans to build. The goal will be in the shape of a triangular prism. The legs of the right triangles at the sides of his goal measure 4 ft and 8 ft, and the opening along the front is 24 ft. How much space is contained within this goal?
Texas Go Math Grade 7 Lesson 10.2 Answer Key 15
Answer:
b = 4 ft Length of base
hB = 8 ft Height of base
h = 24 ft Height of a prism
Find the area of the base B. The base is in the shape of triangle. Use the formula:
Texas Go Math Grade 7 Lesson 10.2 Answer Key 26
Use the formula for the volume of a triangular prism.
V = B . h = 16 . 24 = 384 ft3
This goal contained 384 ft3 of space.

Texas Go Math Grade 7 Lesson 10.2 Higher Order Thinking Answer Key  

Question 15.
A plastic puzzle in the shape of a triangular prism has bases that are equilateral triangles with side lengths of 4 inches and a height of 3.5 inches. The height of the prism is 5 inches. Find the volume of the prism.
Answer:
b = 4 in Length of base
hB = 3.5 in Height of base
h = 5 in Height of a prism
Find the area of the base B. The base is in the shape of a triangle. Use the formula:
Texas Go Math Grade 7 Lesson 10.2 Answer Key 27
Use the formula for the volume of a triangular prism.
V = B . h
= 7 . 5
= 35 in3

The volume of the prism is V = 35 in3.

Go Math 7th Grade Lesson 10.2 Homework Answer Key Question 16.
Persevere in Problem-Solving Lynette’s grandmother has a metal doorstop with the dimensions shown. Find the volume of the metal in the doorstop. The metal in the doorstop has a mass of about 8.6 grams per cubic centimeter. Find the mass of the doorstop.
Texas Go Math Grade 7 Lesson 10.2 Answer Key 16
Answer:
b = 10 cm Length of base
hB= 6 cm Height of base
h = 2.5 cm Height of a prism
Find the area of the base B. The base in the shape of triangle. Use the formula:
Texas Go Math Grade 7 Lesson 10.2 Answer Key 28
Use the formula for the volume of a triangular prism.
V = B . h = 30 . (2.5) = 75 cm3
Mass of the doorstep is 75 . (8.6) = 645\(\frac{\mathrm{g}}{\mathrm{cm}^{3}}\).

The volume of the metal in the door step is V = 75 cm3.
Mass of the doorstep is 645\(\frac{\mathrm{g}}{\mathrm{cm}^{3}}\).

Question 17.
Make a Conjecture Don and Kayla each draw a triangular pyramid that has a volume of 100 cm3. They do not draw identical shapes. Give a set of possible dimensions for each pyramid.
Answer:
Since Don and Kayta did not draw identical shapes of a triangular pyramid. The possible dimensions for the
triangular pyramid with volume of 100 cm3 are:

  • base = 15 cm; height = 10 cm; Height = 4 cm
  • base = 10 cm; height = 12 cm; Height = 5 cm
  • base = 12 cm; height = 5 cm; Height = 10 cm
  • base = 5 cm; height = 10 cm; Height = 12 cm

The possible dimensions for the triangular pyramid with volume of 100 cm3.

Question 18.
Multistep Don’s favorite cheese snack comes in a box of six pieces. Each piece of cheese has the shape of a triangular prism that is 2 cm high. The triangular base of the prism has a height of 5 cm and a base of 4 cm. Find the volume of cheese in the box.
Texas Go Math Grade 7 Lesson 10.2 Answer Key 31
Answer:
Each piece of cheese has the shape of a triangular prism.
For one piece the volume is:
b = 4 cm Length of base
hB = 5 cm Height of base
h = 2 cm Height of a prism
Find the area of the base B.
Texas Go Math Grade 7 Lesson 10.2 Answer Key 29
Use the formula for the volume of a triangular prism.
Vc = B . h = 10 . 2 = 20 cm3
We have six pieces in the box, so the volume of cheese in the box is:
V = 6 . Vc = 6 . 20 = 120 cm3

The volume of cheese in the box is V= 120 cm3.

Go Math Grade 7 Answer Key Pdf Volume of Triangular Prism Answer Key Question 19.
Analyze Relationships What effect would doubling all the dimensions of a triangular pyramid have on the volume of the pyramid? Explain your reasoning.
Answer:
B = B Base area
h = h Height of a pyramid
Use the formula for the volume of a triangular pyramid.
V1 = \(\frac{1}{3}\) . B . h
Now double all the dimensions of the triangular pyramid.
B = 2 . B Base area
h = 2 . h Height of a pyramid
Use the formula for the volume of a triangular pyramid.
V2 = \(\frac{1}{3}\) . 2 . B . 2 . h
= \(\frac{1}{3}\) . 4 . (B . h)
= 4 . \(\frac{1}{3}\) . (B . h)
= 4 . V1
Doubting at the dimension of a triangular pyramid, its volume is quadrupling

Texas Go Math Grade 7 Lesson 10.2 Answer Key Volume of Triangular Prisms and Pyramids Read More »

Texas Go Math Grade 7 Lesson 13.3 Answer Key Making Purchasing Decisions

Refer to our Texas Go Math Grade 7 Answer Key Pdf to score good marks in the exams. Test yourself by practicing the problems from Texas Go Math Grade 7 Lesson 13.3 Answer Key Making Purchasing Decisions.

Texas Go Math Grade 7 Lesson 13.3 Answer Key Making Purchasing Decisions

Example 1.
Silvie went to a local warehouse store to buy her family’s favorite sports drink. Which of the two options described below is the better buy?
Texas Go Math Grade 7 Lesson 13.3 Answer Key 1
Step 1
Find the total amount of the sports drink in each purchase.
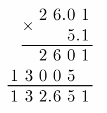
Value Pack: 24(0.5) = 12 liters
Sport pack: 18(0.75) = 13.5 liters
Step 2
Find each unit price.
Texas Go Math Grade 7 Lesson 13.3 Answer Key 2
The Value Pack is a better buy, because $0.77 < $0.88.

Your Turn

Grade 7 Go Math Answer Key Lesson 13.3 Answer Key Question 1.
Financial Literacy Manny must choose between a pack of four 6.5-ounce containers of yogurt for $3.77 or three 8-ounce containers at $1.29 each. Which ¡s the better buy? Why?
Answer:
Find the total. amount of the yogurt in each purchase.
A pack of 46.5 – ounce containers
4 × 6.5 = 26 – ounces
A pack of 38- ounce containers
3 × 8 = 24 – ounces

Now, find each unit price.
A pack of 46.5-ounce containers
\(\frac{\$ 3.77}{26-\text { ounces }}\) = $0.145 per ounce

A pack of 38-ounce containers
Each 8—ounce container costs $1.29. hence the price of 3 containers is
3 × $1.29 = $3.87.
\(\frac{\$ 3.87}{24-\text { ounces }}\) = $0.16 per ounce

Better buy is a pack of 4 6.5— ounce containers, because $0.145 < $0.16

Example 2
Nathan plans on hiking this summer and wants to buy a solar charger for his cell phone and notebook computer. He finds the charger that he wants at two stores. Which store has the lower price for the charger?
Texas Go Math Grade 7 Lesson 13.3 Answer Key 3
Texas Go Math Grade 7 Lesson 13.3 Answer Key 4
Answer:
Step 1
Find the discount price at each store.
Kitt’s
discount price = regular price – discount
= $89.99 – 0.3($89.99)
= $89.99 – $26,997
= $62,993
To the nearest cent, the discount price at Kitti’s is $62.99

Rec Plus
discount price = regular price – discount
= $79.99 – $15.00
= $64.99
The discount price at Rec Plus is $64.99.

Step 2
Compare the discounted prices.
Kitt’s offers the lower price, because $62.99 < $64.99.

Reflect

Question 2.
Critical Thinking Why might Nathan choose the higher priced item?
Answer:
Nathan would choose the charger in Kitt’s even if it has a higher regular price. This is because the discount in Kitt’s is higher compared to the Rec Plus. Once the regular price for the charger in Kitt’s got discounted, the price is cheaper compared to the discounted price in Rec Plus.

The discount is higher for the higher-priced item which made it cheaper after the discount

Your Turn

Go Math Lesson 13.3 Answer Key Grade 7 Question 3.
Nathan finds a backpack at Kitt’s that is regularly $84.99 but is on sale for \(\frac{1}{3}\) off. The same backpack is regularly $72.99 at Rec Plus but is on sale for 25% off. Which is a better buy? Explain.
Answer:
Find the discount price at each store.
Kitts
Discount price = Regular price – Discount
To find the Discount, multiply the Regular price by the percent of the discount.
$84.99 × \(\frac{1}{3}\) = $28.33
Discouut price = $84.99 – $28.33
Discount price = $56.66
The Discount price at Kitt’s is $56.66.
Rec Plus
Discount price = Regular price – Discount
To find the Discount multiply the Regular price by the percent of discount. Write the percent as decimal, ie 25% = 0.25.
$72.99 × 0.25 = $18.25
Discount price = $72.99 – $18.25
Discount price = $54.74
Tue Discount price at Rec Plus is $54.74.
Rec Plus offers the lower price, because $54.74 <$56.66.

Example 3.
Cedelia can get the same running Go shoes at two different stores. She wants to get two pairs of the same style. Which is the better buy?
Texas Go Math Grade 7 Lesson 13.3 Answer Key 5
Go Run
Texas Go Math Grade 7 Lesson 13.3 Answer Key 6
She pays $104 for 2 pairs.
Shoe Shoppe
Texas Go Math Grade 7 Lesson 13.3 Answer Key 7
She pays 2 × $59 = $118 for 2 pairs
Go Run has the better buy because $104 < $118.
Answer:

Reflect

Question 4.
What If? Suppose the total price at Shoe Shoppe had been $103? What are some conditions of a rebate that would make it a better decision to buy the shoes at Go Run?
Answer:
First condition
If the first pair has rebate at least $7 and you get second pair free.
Proof:
Regular price is $109, rebate is at least $7, hence the total price at Go Run is $109 — $7 = $102.
$102 < $103
Hence, Go Run lias the better buy than Shoe Shoppe.

Second condition
If both pairs have a discount of 53%.
Proof:
The regular price is $109.
Discount price = Regular price – Discount
To find the Discount multiply the Regular price by the percent of discount.
Write percent as decimal, ie 53% = 0.53.
$109 × 0.53 = $57.77

Discount price = $109 – $57.77
Discount price = $51.23
The Discount price of one pair is $51.23, and the discount price of 2 pairs is
$51.23 × 2 = $102.16
$102.46 < $103
Hence, Go Run is a better buy than Shoe Shoppe.

First condition: If the first pair has a rebate at least $7 and you get the second pair free.
Second condition: If both pairs have a discount of 53%.

Your Turn

Go Math Answer Key Grade 7 Lesson 13.3 Question 5.
Greta wants to buy 3 jars of honey. Food Mart sells it for $8.99 with a “Buy 2, get 1 free” offer. Leona’s sells it for $8.49 with a coupon for 50% off with a limit of 2 coupons. Which store has the better deal?
Answer:
Food Mart
Greta wants to buy 3 jars of honey, and Food Mart has an offer if you buy 2 you get 1 free.
Hence, Greta will buy 2 jars of honey and get one free, and that would be 3 jars of honey she needs.
One jar costs $8.99. so
Price of 2 jars = 2 × $8.99 = $17.98
Greta would pay $17.98 for 3 jars of honey at Food Mart.

Leona‘s
At Leon’s she can buy 2 jars with a coupon for 50% off, because there is a limit of 2 coupons.
Hence, the third jar of honey she has to buy by the full price.
One jar of honey costs $8.19.
Let’s find the Discount price with a coupon.
Discount price = Regular price – Discount
To find the Discount multiply the Regular price by the percent of discount.
Write percent as decimal, ie 50% = 0.5.
$8.19 × 0.5 = $4.215
Discount price = $8.49 – $4.245
Discount price = $4.245

The Discount price of one jar of honey is $4.245.
She would buy 2 jars of honey by the discount price and the third one by the full price.
Hence
Price of 3 jars = 2 × Discount price + Full price
Price of 3 jars = 2 × $4.245 + $8.49
Price of 3 jars = $16.98
Greta would pay $16.98 for 3 jars of honey at Leona’s.
Hence, Leon’s has the better buy, because $16.98 < $17.98.

Texas Go Math Grade 7 Lesson 13.3 Guided Practice Answer Key  

Which is the better buy? Write an inequality to justify your answer.

Question 1.
The Corner Store sells 4 bottles of energy drink for $1 1.56. Bev’s sells 6 bottles for $17.94. Which is the better buy? (Example 1)
Texas Go Math Grade 7 Lesson 13.3 Answer Key 8
Answer:
Find the price of one energy drink in each purchase.
The Corner Store
4 bottles of energy drink cost $11.56.
Find the price of one bottle of energy drink.
Price of one bottle = \(\frac{\$ 11.56}{4}\) = $2.89/bottle
The price of one bottle at Coriier Store is $2.89 per bottle.

Bev’s
6 bottles of energy drink cost $17.94.
Find the price of one bottle of energy drink.
Price of 0ne bottle = \(\frac{\$ 17.94}{6}\) = $2.99/bottle
The price of one bottle at Bev’s is $2.99 per bottle.
The Corner Store lias the better buy, because $2.89 < $2.99.

The Corner Store has the better buy, because $2.89 <$2.99.

Lesson 13.3 Independent Practice Answer Key Question 2.
You can buy a 2-pound loaf of bread for $2.50 or a 2-pack of 1\(\frac{1}{2}\)-pound loaves for $3.30. Which is the better buy?(Example 1)
Answer:
Find the price of 0ne pound loaf of bread in each purchase.
First purchase
2-pound loaf of bread for 82.50
Find the price of one pound loaf of bread.
Price of one pound = \(\frac{\$ 2.50}{2}\) = $1.25
The price of one pound of loaf of bread is $1.25.
Second purchase
2- pack of 1\(\frac{1}{2}\)– pound loaf of bread for $3.30
In this purchase we have 2-pack of 4\(\frac{1}{2}\) = \(\frac{3}{2}\) = 1.5- pound loaves.
Hence, the whole purchase will be 2 × 1.5 =3.
So, 3- pound loaf of bread costs $3.30.
Find the price of one pound loaf of bread.
Price of one pound = \(\frac{\$ 3.30}{3}\) = $1.1
The price of one pound of loaf of bread is $1.1.
Second puchase is the better, because $1.1 < $1.25.

Question 3.
Marta can buy a 6-pack of 15-ounce cans of broth for $11.29 or three 32-ounce containers for $10.97. Which is the better buy? (Example 1)
Texas Go Math Grade 7 Lesson 13.3 Answer Key 9
Answer:
First purchase
A 6- pack of 15- ounce cans of broth
6(15) = 90 oz
Now, find unite price
\(\frac{\$ 11.29}{90-\mathrm{oz}}\) = $0.125/oz

Second purchase

A 3-32- contains
3(32) = 96 oz
Now, find unite price
\(\frac{\$ 10.97}{96-\text { ounces }}\) = $0.11/oz
Second purchase is the better, because $0.11 <$0.125.

Question 4.
Zena can get an item online for $19 that weighs 8 pounds. Shipping and handling costs $0.49 per pound. She can also buy the same item locally for $26.95, and she has a $5 off coupon. Which is the better buy? (Example 2)
Answer:
The item has 8 pounds and shipping and handling per pound is $0.49.
Shipping and handling for item is
$0.49 × 8 = $3.92
To find the whole price of item sum the online price and the cost of shipping and handling.
$19 + $3.92 = $22.92
Online purchase costs $22.92.

Locally purchase
$5 off coupon is a Discount.
Find the Discount price.
Discount price = Regular price — Discount
Discount price = $26.95 — $5
Discount price = $21.95
The Discount price for locally purchase is $21.95.
The locally purchase is better, because $21.95 <$22.92.

Question 5.
A take-and-bake pizza chain has several coupons, which cannot be used together. J.D. is buying a pizza that costs $17.90. Should he use a $5 off coupon or a 35% off coupon? (Example 2)
Answer:
$5 off coupon
$5 off coupon is a Discount.
Find the Discount price.
Discount price = Regular price – Discount
Discount price = $17.90 – $5
Discount price = $12.90
The Discount price of a pizza with a $5 off coupon is $12.90.

35% off coupon
Discount price = Regular price – Discount
To find the Discount multiply the Regular price by the percent of discount.
Write percent as decimal, ie 35% = 0.35.
$17.90 × 0.35 = $6.26
Discount price = $17.90 – $6.26
Discount price = $11.64
The Discount price of a pizza with a 35% coupon off is $11.64.
J.D. should use a 35% off coupon, because $11.61 <$12.90.

Question 6.
The King family buys an HDTV selling for $825 at PanView with a 20% off coupon and a rebate of $125. They later see the TV on sale at Rey’s TVs for $555. Did they get the better deal? (Example 3)
Answer:
Determine the cost of the HDTV the King fami[y purchased at PanView. Show the 20% off coupon as decimaL
825 × 0.20 = 165 Determine the discount for the HDTV
825 – 165 = 660 Subtract the discount from the original price
660 – 125 = 535 Subtract the rebate from the discounted price
The King family get the better deal. purchasing the HDTV at PanView instead at Rey’s TVs
Yes

Question 7.
Credit card A has an annual fee of $50 but gives you a rebate at the end of the year of 2% of your total purchases. Credit card B has no annual fee or rebate. If you spend about $150 a month, which card is better for you? (Example 3)
Answer:
Credit card A
If you spend $150 a month, it means that you spend 12 × $150 = $1,800 a year.
Credit card A has an annual fee of $50, hence, we have to add fee to the amount you spend a year.
$1,800 + $50 = $1,850
At the end of the year you get a rebate of 2% of your total purchase, hence we have to subtract 2% from the whole amount $1,850.
Write percent as decimal, ie 2% = 0.02.
Find 2% of $1,850.
$1,850 × 0.02 = $37
Now subtract.
$1,850 – $37 = $1,813
If you use Credit card A, you will spend $1,813 a year.

Credit card B
Credit card B has no annual or rebate, hence, yearly you will spend
12 × $150 = $1,800
If you use Credit card B, you will spend $1,800 a year.

Hence, the Credit card B is better, because $1,800 < $1,813.

Essential Question Check-In

Question 8.
Is the lower unit price always the best buy?
Answer:
No, it is not always.
Sometimes there is an offer like, “Buy 2, get 1 free” of items with higher unit price.
Also, there is some discount on quantity on items with higher unit price, which could be better buy than buy of unit with lower unit price without discount.
The quality of the product when you buy it, regardless of the price, should not be neglected.

Texas Go Math Grade 7 Lesson 13.3 Independence Practice Answer Key   

Question 9.
Store 1 has a price of $99 on an MP3 player. Store 2 is offering the same MP3 player at a sale price of 25% off their regular price of $125. Jerusha wants to buy an MP3 player. From which store should she buy it? Explain.
Answer:
Store 2
Discount price = Regular price – Discount
To find the Discount multiply the Regular price by the percent of discount.
Write percent as decimal, ie 25% = 0.25.
Discount = $125 × 0.25 = $31.25
Discount price $125 – $31.25
Discount price = $93.75
The Discount price of an MP3 player in Store 2 is $93.75.

The price of an MP3 player in Store 1 is $99.
He should buy an MP3 player in Store 2, because $93.75 < $99.

Question 10.
Multistep Randy wants trail mix for his hiking trip. The ready-made trail mix costs $8.95 for 1.5 pounds. The costs of the bulk ingredients to make one pound of trail mix are as follows: salted peanuts—$1.25, raisins—$1.70, sunflower seeds—$0.50, cashews—$0.87, and almonds—$0.65. If Randy plans to take 6 pounds of trail mix, which option is cheaper? How much does he save by choosing the cheaper option?
Answer:
The ready-made trail mix
A pack of 1.5 pounds costs $8.95. and Randy wants to buy 6 pounds of it.
Hence, he needs to buy 1 packs of 1.5 pounds of trail mix.
The cost of 6 pounds of ready—made trail mix will be
4 × $8.95 = $35.8
6 pounds of ready-made trail mix will cost $35.8.
Self—made trail mix
To find the cost of one pound of trail mix. prices of all ingredients should be summed up.
One pound of self-made trail mix = $1.25 + $1.70 + $0.50 + $0.87 + $0.65 = $4.97
To find the cost of 6 pounds of self-made trail mix multiply by 6 the cost of one pound.
6 × $4.97 = $29.82
The cost of 6 pounds of self-made trail mix will be $29.82.

The self-made trail mix is cheaper option than the readymade trail mix, because $29.82 < $35.8.

Grade 7 Go Math Practice and Homework Lesson 13.3 Answer Key Question 11.
Tyron and Penelope both bought 4-wheelers. Tyron paid $199 upfront and will pay the remainder in 12 payments of $50 each. Penelope paid nothing up front, and will make 18 payments of $49. Who got the better buy? Explain.
Answer:
Tyron
To find how much Tyron paid 4—wheeler, sum the amount he paid up front and the total remainder.
First, find the total remainder.
To find the total remainder multiply the number of payments by the amount of each payment.
The total remainder = 12 × $50 = $600
Now, find the total cost.
The total cost of 4—wheeler = $199 + $600 = $799
Tyron paid $799 for 4—wheeler.

PeneloPe
Unlike Tyron Penelope will pay the price in 18 payments of $49.
To find the total cost multiply the number of payments by the amount of each palyment.
The total cost of 4—wheeler = 18 × $19 = $882
Penelope paid $882 for 4—wheeler.
Tyron lias the better buy that Penelope, because $799 < $882.

Question 12.
Financial Literacy T’Shonda is buying a laptop computer. She will pay 8% sales tax on the price before ány rebates. Where will she get a better buy? Explain.
Texas Go Math Grade 7 Lesson 13.3 Answer Key 10
Answer:
XYZ-Tronic
First, find the sales tax on the price(Subtotal).
Write the tax rate as decimal, ie 8% = 0.08
Tax = Subtotal × Tax rate
Tax = $629 × 0.08 = $50.32
Now, add the subtotal and the tax to find the total price.
Total price = $629 + $50.32 = $679.32
The Total price before rebate is $679.32
To find the price after rebate, subtract mail—in—rebate from the Total price.
The price after rebate = $679.32 – $150 = $529.32
In XYZ-Tronic she would pay $529.32 for a laptop.

Tec U—Comp
First, find the sales tax on the price(Subtotal).
Write the tax rate as decimal. ie 8% = 0.08
Tax = Subtotal × Tax rate
Tax = $649 × 0.08 = $51.92
Now, add the subtotal and the tax to find the total price.
Total price = $649 + $51.92 = $700.92
The total price before rebate is $700.92

To find the price after rebate(The Discount price), subtract the Discount of 25% from the Total price(Regular price).
Discount price = Regular price — Discount
To find the Discount multiply the Regular price by the percent of discount.
Write percent as decimal, ie 25% = 0.25.
Discount = $700.92 × 0.25 = $175.23
Discount price = $700.92 – $175.23
Discount price = $525.69
The Discount price of a laptop is $525.69.
T’Shonda will get the better buy in Tec—U-Comp, because $525.69 < $529.32.

Question 13.
Critical Thinking What single discount is equal to a discount of \(\frac{1}{4}\) off followed by an additional 10% off the sale price?
Answer:
We want to know what single discount is equal to these discounts together.
First, there is a discount of 25%.

Write a fraction as decimal, ie \(\frac{1}{4}\) = 0.25
Now, write the decimal as percent, ie 0.25 = 25%
Hence, when some item has discount of \(\frac{1}{4}\), it means that item has discount of 25%.
After the discount of 25%, the total cost of that item is actually 75% of the regular price(the regular price
represents 100% of the item) of that item, because 100% – 25% = 75%.

After the discount of 25%, there is an additional. discount of 10%.
An additional discount of 10% we can not compute on 100% of item price, because now the actual cost of the
item is 75% of the first regular price(because first we had a discount of 25%).
So, now we have to find 10% of 75% and subtract from it
Write percent as decimal, ie 10% = 0.1
To find 10% of 75%, multiply 75% by the percent written in decimal.
75% × 0.1 = 7.5%
Now, subtract.
75% – 7.5% = 67.5%

Finally, the total cost of the item with first discount of 25% and then an additional 10% is 67.5% of the reguLar
price of that item.
As the cost of an item is now 67.5%, this means that these two discounts together represent a 32.5% discount,
because 100% – 67.5% = 32.5%.
Hence, the single discount that is equal to a discount of \(\frac{1}{4}\) off followed by an additional 10% off is 32.5% off.

The single discount that is equal to a discount of \(\frac{1}{4}\) off followed by an additional 10% off is 32.5% off.

Question 14.
Make a Conjecture John is comparing the prices of two bags of the same cereal. He notices that the larger bag holds 10 more ounces and costs $1.50 more. How can he use the unit price of the smaller bag to decide the better buy? Explain.
Answer:
John can use the unit price of the smaller bag by multiplying it by 10 since the larger bag contains 10 more ounces. If the result of this is more than $1.50, then it is better to buy the larger bag instead of the smaller bag. But if the result is less than $1.50, it is still better to buy the smaller bag.

Multiply the unit price of the smaller bag by 10.

Texas Go Math Grade 7 Lesson 13.3 H.O.T. Focus on Higher Order Thinking Answer Key   

Question 15.
Draw Conclusions Mr. Jaros has the following options for buying a digital video recorder and access to the recording service for 2 years.
DiV: $49.99 digital video recorder, 2-year subscription at $16.98 a month
TVU: Free digital video recorder, 2-year commitment at $19.95 a month
a. Which is the better deal? Explain.
Answer:
DiV
To find the total cost. of a digital video recorder and access to the recording service for 2 years we have to sum the cost of digital video recorder and the total cost of 2—year subscription.
To find the total cost of subscription multiply the number of months by monthly fee for subscription.
One year have 12 months, and 2 years have 2 × 12 = 24 months.
The total cost of subscription = 24 × $16.98 = $407.52
Now find the total cost of a digital video recorder and access to the recording service for 2 years.
$49.99 + $407.52 = $457.51
The offer at DiV would cost $457.51.

TVU
At TVU Mr.Jaros can get free digital video recorder and only would pay 2- year commitment at $19.93.
So, the total cost of a digital video recorder and access to the recording service for 2 years is actually the cost of total 2—years commitment.
To find the total cost of commitment multiply the number of months by monthly fee.
One year has 12 months, and 2 years have 2 × 12 = 24 months.
The total cost of commitment = 24 × $19.95 = $478.8
The offer at TVU would cost $478.8.

The better deal is at DiV, because $457.51 < $478.8.

b. What If? Suppose each offer were for 1 year. Would that change your answer? Explain.
Answer:
Div
To find the total cost of a digital video recorder and access to the recording service for 1 years we have to sum the cost of digital video recorder and the total cost of 1-year subscription.
To find the total cost of subscription multiply the number of months by monthly fee for subscription.
One year has 12 months.
The total cost of subscription = 12 × $16.98 = $203.76
Now find the total cost of a digital video recorder and access to the recording service for 1 years.
$49.99 + $203.76 = $253.75
The offer at DiV would cost $253.75.

TVU
At TVU Mr.Jaros can get free digital video recorder and only would pay 1-year commitment at $19.95.
So, the total cost of a digital video recorder and access to the recording service for 1 years is actually the cost of total 1-years commitment,
To find the total cost of commitment multiply the number of months by monthly fee.
One year has 12 months.
The total cost of commitment = 12 × $19.95 = $239.4
The offer at TVU would cost $239.4.

If the offer were for 1 year, the better deal would be at TVU, because $239.4 < $253.75.

c. Make a Conjecture Find the difference in monthly rates. Divide the cost of the DiV digital video recorder by the difference and round up to the nearest whole number. What does this quotient represent?
Answer:
The difference in monthly rates = $19.95 = $16.98 = $2.97
Now, divide the cost of the DiV digital video recorder by the difference we calculated.
\(\frac{49.99}{2.97}\) = 16.83 ≈ 17
This quotient respresent the number of months.
If the offer were for this number of months, both offers would cost almost the same(because we round up the
quotient to the nearest whole number).
Proof:
DiV
The total cost of subscription = 17 × $16.98 = $288.66
To find the total cost of a digital video recorder and access to the recording service for 17 months we have to sum
the cost of digital video recorder and the total cost of 17 months subscription.
$49.99 + $288.66 = $338.65
TVU
To find the total cost of commitment multiply the number of months by monthly fee.
The total cost of commitment = 17 × $19.95 = $339.15
$338.65 ≈ $339.15

This quotient respresent the number of months. If the offer were for this number of months. Both offers would cost almost the same.

Question 16.
Analyze Relationships Sandy wants to buy 5 pounds of apples. She has a coupon for $1.00 off for every 3 pounds of apples. She gets to the store and discovers that apples are on sale for $0.75 a pound. Is it cheaper for her to buy 5 pounds or 6 pounds? Explain.
Answer:
If Sandy buys 5 pounds of apples. she can use only one coupon for $1 off, because the coupon is valid for every 3 pounds.
The cost of 011e pound of apples is $0.75.
Hence, 5 pounds of apples. without coupon, will cost
5 × $0.75 = $3.75
Now, to find the cost of 5 pounds of apples with a coupon. subtract $1 from $3.75.
$3.75 – $1 = $2.75
Hence, 5 pounds of apples will cost $2.75

If Sandy buys 6 pounds of apples. she can use only two coupon for $1 off, because the coupon is valid for every 3 pounds.
The cost of 0ne pound of apples is $0.75.
Hence, 6 pounds of apples, without coupon, will cost
6 × $0.75 = $4.5
Now, to find the cost of 6 pounds of apples with two coupon, subtract $2(because she can use 2 coupons) from $4.5.
$4.5 – $2 = $2.5
Hence, 6 pounds of apples will cost $2.5

It is cheaper for Sandy to buy 6 pounds of apples. because $2.5 <$2.75.

Question 17.
Draw Conclusions Two stores have a sale on T-shirts originally priced at $8.50. Yeager’s has a “Buy 2, get 1 free” sale. Gample’s has a 30% off sale. Dirk wants to buy only 2 T-shirts. Which is the better buy for him? Explain your reasoning.
Answer:
Yeager ‘s
Yeager’s offer is “3 T-shirts for the price of 2”, ie “buy 2, get 1 free”.
Dirk wants to buy only 2 T-shirts, but buying 2 T-shirts will definitely get a third one.
Let ‘s see how much those 3 shirts would cost.
The price of 1 T-shirt is $8.50, so Dirk would pay for 2 T-shirts, and get a third one for free.
The price of 3 T-shirts = 2 × $8.50 = $17
3 T-shirts would cost $17, but we want to know what is the value of 2 T-shirts.
To find that, divide $17 by 3.
The value of one T-shirt, = \(\frac{\$ 17}{3}\) = $5.67
Time value of 2 T-shirts = 2 × $5.67 = $11.34
The value of 2 T-shirts at Yeager’s is $11.34.

Gample’s

Gamples offer is a discount of 30% on each T—shirt.
Let’s find how much one T-shirt would cost, ie the Discount price.
Discount price = Regular price – Discount
To find the Discount multiply the Regular price by the percent of discount.
The regular price of 1 T-shirt is $8.50.
Write percent as dechnal, ie 30% = 0.30.
Discount = $8.50 × 0.30 = $2.55
[)iscount price = $8.50 – $2.55
Discount price = $5.95
The Discount price of one T-shirt is $5.95.
The Discount price(the value) of 2 T-shirts at Cample’s is 2 × $5.95 = $11.9.

Hence, the better buy for Dirk is at Yeager’s, because the value of 2 T-shirts is less than the value at Gample’s, ie $11.34 < $11.9.

The better buy for Dirk is at Yeager’s, because $11.34 < $11.9.

Question 18.
Represent Real-World Problems Suppose you are buying books from an online store, and the total price of your books is $39. Orders of $50 or more for eligible items qualify for free shipping. Would you buy more to qualify for free shipping? Or would you check out with only the books you have in your shopping cart? Explain your answer.
Answer:
The first question that would come into your mind is, how much is the shipping fee for the books with a total price of $39. If the shipping fee is more than $11, it is better to buy another book which will make the total price at $50. But if the shipping fee is less than $11, lets say $5 and you really don’t have any book to purchase, then you could just pay the shipping fee and your total price will still be less than $50.

It depends on the amount of the shipping fee

Texas Go Math Grade 7 Lesson 13.3 Answer Key Making Purchasing Decisions Read More »

Texas Go Math Grade 7 Module 10 Quiz Answer Key

Refer to our Texas Go Math Grade 7 Answer Key Pdf to score good marks in the exams. Test yourself by practicing the problems from Texas Go Math Grade 7 Module 10 Quiz Answer Key.

Texas Go Math Grade 7 Module 10 Quiz Answer Key

Texas Go Math Grade 7 Module 10 Ready to Go On? Answer Key

10.1 Volume of Rectangular Prisms and Pyramids

Find the volume of each figure.

Question 1.
Texas Go Math Grade 7 Module 10 Quiz Answer Key 1
Answer:
l = 11 yd length of base
w = 9 yd Width of base
h = 7 yd Height of a prism
Find the area of the base B. A prism has a base that is rectangular, so use the formula:
B = l.w = 11.9 = 99 yd2
Use the formula for the volume of a rectangular prism.
V = B.h = 99 . 7 = 693 yd3

The volume of a rectangular prism is 693 yd3.

Grade 7 Math Module 10 Answer Key Question 2.
Texas Go Math Grade 7 Module 10 Quiz Answer Key 2
Answer:
l = 12 ft length of base
w = 16 ft Width of base
h = 18 ft Height of a pyramid

Find the area of the base B.

B = l . w = 12 . 16 = 192 ft2
Use the formula for the volume of a rectangular pyramid.
Texas Go Math Grade 7 Module 10 Quiz Answer Key 10
The volume of a rectangular pyramid is 1152 ft3.

The volume of a rectangular pyramid is 1152 ft3.

10.2 Volume of Triangular Prisms and Pyramids

Find the volume of each figure.

Question 3.
Texas Go Math Grade 7 Module 10 Quiz Answer Key 3
Answer:
A prism has a base that is right triangle.
a = 8 cm length of one side of the triangle
b = 17 cm length of other side of the triangle
Find the area of the base B. Use the formula:
Texas Go Math Grade 7 Module 10 Quiz Answer Key 11
B = 68 cm2 Base of prism
h = 40 cm Height of a prism
Use the formula.
V = B . h = 68 . 40 = 2720 cm3
The volume of a triangular prism is 2720 cm3.

Module 10 Form B Module Test Answer Key Question 4.
Texas Go Math Grade 7 Module 10 Quiz Answer Key 4
Answer:
b = 5 m length of base
hB = 15 m height of base
h = 22 m Height of a pyramid
Find the area of the base B. Use the formula:
B = \(\frac{1}{2}\) . b . hB = \(\frac{1}{2}\) . 5 . 15 = 37.5 m2
Use the formula for the voLume of a triangular pyramid:
V = \(\frac{1}{3}\)B . h = \(\frac{1}{3}\) . (37.5) . 22 = 275 m3
The volume of a triangular pyramid is 275 m3.

10.3 Lateral and Total Surface Area

Find the lateral and total surface area of each figure using its net.

Question 5.
Texas Go Math Grade 7 Module 10 Quiz Answer Key 5
Answer:
Find the Lateral area of the triangular pyramid.
We have three triangles with base of 19.2 m. and height of 40 m.
b = 19.2 m length of base
hB = 40 m Height of base
Lateral area:
Texas Go Math Grade 7 Module 10 Quiz Answer Key 12
For the area of the base:
b = 24 m length of base
hb = 15 m Height of base
The area of the base is
Texas Go Math Grade 7 Module 10 Quiz Answer Key 13
The total surface area is 1152 + 180 = 1332 m2

The Lateral area is 1152 m2.
The total surface area is 1332 m2.

Module 10 Quiz Ready To Go On Answers 7th Grade Question 6.
Texas Go Math Grade 7 Module 10 Quiz Answer Key 6
Answer:
Find the Lateral area of the rectangular prism.
We have:
Two 12 in. by 6 in. rectangle;
Two 10 in. by 6 in. rectangle;
2 . (12 . 6) = 144
2 . (10 . 6) = 120
Lateral area: 144 + 120 = 264 cm2
Each base is 12 in. by 10 in.
2 . (12 . 10) = 2 . 120 = 240 cm2
The total surface area is 264 + 240 = 504 cm2.

The Lateral area is 264 cm.
The total surface area is 504 cm2.

Essential Question

Question 7.
How can you use volume and surface area to solve real-world problems?
Answer:
Volume and surface area can be used in many ways to solve the real-world problems such as:
For example we are making a new thing of copper and we know the volume of that thing so we can know the exact amount of copper required for making that thing by using the density = \(\begin{gathered}
\text { Mass } \\
\hline \text { Volume }
\end{gathered}\)of copper

In another example suppose a wall is to be painted and the cost of paint one square meter of wall is given then we can easily calculate the total cost for painting wall by using the total surface area of wall.

Volume can be use for calculating amount of material required for making something.

Texas Go Math Grade 7 Module 10 Mixed Review Texas Test Prep Answer Key 

Selected Response

Question 1.
The volume of a triangular pyramid is 232 cubic units. The area of the base of the pyramid is 29 square units. What is the height of the pyramid?
(A) 8 units
(B) 12 units
(C) 16 units
(D) 24 units
Answer:
(D) 24 units

Explanation:
Use formula for the volume of a triangular pyramid.
B = 29 square units Base of pyramid
h = ? Height of a pyramid
V = 232 cubic units The volume of a pyramid
Use the formula for the volume of a pyramid to find a height of the pyramid.
V = \(\frac{1}{3}\) . B . h.
232 = \(\frac{1}{3}\) . 29 . h
232 = (9.66) . h
Divide both sides by 9.66.
Texas Go Math Grade 7 Module 10 Quiz Answer Key 14
The height of the pyramid is 24 units

Question 2.
What is the volume of a rectangular prism that has a length of 8.5 centimeters (cm), a width of 3.2 centimeters, and a height of 6 centimeters?
(A) 19.2 cm3
(B) 27.2 cm3
(C) 51 cm3
(D) 163.2 cm3
Answer:
(D) 163.2 cm3

Explanation:
h = 6 cm Height of prism
l = 8.5 cm Length of base
w = 3.2 cm Width of base
Use the formula for the volume of a rectangular prism
V = B . h = l . w . h
= (8.5) (3.2) . h
= (27.2) . 6
= 163.2 cm3
The volume of a rectangular prism is V = 163.2 cm3

Question 3.
What is the volume of the rectangular pyramid shown?
Texas Go Math Grade 7 Module 10 Quiz Answer Key 7
(A) 1,650 yd3
(B) 2,200 yd3
(C) 3,300 yd3
(D) 6,600 yd3
Answer:
h = 22 yd Height of pyramid
l = 15 yd Length of base
w = 20 yd Width of base
Use the formula for the volume of a rectangular pyramid.
V = \(\frac{1}{3}\) . B . h. = \(\frac{1}{3}\) . l . w . h.
= \(\frac{1}{3}\) . 15 . 20 . 22
= 2200 yd3

The volume of the rectangular pyramid is V = 2200 yd3.

Module 10 Volume Quiz Answer Key Question 4.
A circle has a circumference of 56π centimeters (cm). What is the radius of the circle?
(A) 28 cm
(B) 56 cm
(C) 88 cm
(D) 112 cm
Answer:
(A) 28 cm

Explanation:
Given circumference of circle in probem = 56π cm
We know that circumference of circle of radius “r” = 2π . r
2π . r = 56π (By using above formula)
r = \(\frac{56 \pi}{2 \pi}\) (Dividing both side by 2π)
r = 28 cm (Simplifying)
hence, option A is correct answer.

Question 5.
What is the volume of a triangular prism that has a height of 45 meters and has a base with an area of 20 square meters?
(A) 225 m3
(B) 300 m3
(C) 450 m3
(D) 900 m3
Answer:
(D) 900 m3

Explanation:
h = 45 m Height of a prism
B = 20 m2 Base area
Use the formula for the volume of a triangular prism.
V = B . h
= 20 . 45
= 900 m3

The volume of a triangular prism is V = 900 m3.

Question 6.
What is the total surface area of the square pyramid whose net is shown?
Texas Go Math Grade 7 Module 10 Quiz Answer Key 8
(A) 256 in2
(B) 336 in2
(C) 576 in2
(D) 896 in2
Answer:
(C) 576 in2

Explanation:
For lateral area:
There are four triangles with base of 16 in. and height of 10 in.
Texas Go Math Grade 7 Module 10 Quiz Answer Key 15
Lateral area: 320 in2
The base has the shape of 16 in. by 16 in. rectangle.
Base area:
1 (16 . 16) = 256 in2
The total surface area is 320 + 256 = 576 in2

The surface area is 576 in2.

Gridded Response

Volume and Surface Area Quiz Answers Module 10 Question 7.
What is the lateral area in square meters of the prism?
Texas Go Math Grade 7 Module 10 Quiz Answer Key 16
Answer:
Lateral area of the prism will be the sum of areas of all the surface except base in the given figure.
Length of the rectangle = 18 in
Breadth of the rectangle = 10 m
Base of the triangle = 12 in
Height of the triangle = 8 in
We know that area of the rectangle is = Length × Breadth
We know that area of the triangle is = \(\frac{1}{2}\) × Base × Height
Area of rectangle = 18 × 10 m2
= 180 m2
Area of triangle = \(\frac{1}{2}\) × 12 × 8 m2
= 48 m2

Lateral area of prism = 2 × Area of rectangle + 2 × Area of triangle
= (2 × 180) + (2 × 48)
= 360 + 96
= 456 m2

Hence, lateral area of the prism is 456 m2

Steps to plot the given box are:
In 1st column : mark “+” sign
In 2nd column : mark “0”
In 3rd coumn: mark “4”
In 4th column : mark “5”
In 5th column : mark “6”
In 6th column : mark “0”
In 7th column : mark “0”

Lateral area of the prism is 456 m2

Texas Go Math Grade 7 Module 10 Quiz Answer Key Read More »

Texas Go Math Grade 7 Module 10 Answer Key Volume and Surface Area

Refer to our Texas Go Math Grade 7 Answer Key Pdf to score good marks in the exams. Test yourself by practicing the problems from Texas Go Math Grade 7 Module 10 Answer Key Volume and Surface Area.

Texas Go Math Grade 7 Module 10 Answer Key Volume and Surface Area

Essential Question
How can you use volume and surface area to solve real-world problems?

Texas Go Math Grade 7 Module 10 Answer Key 1

Texas Go Math Grade 7 Module 10 Are You Ready? Answer Key

Complete these exercises to review skills you will need for this chapter.

Write a Mixed Number as an Improper Fraction

Example
Texas Go Math Grade 7 Module 10 Answer Key 2

Write each mixed number as an improper fraction.

Texas Go Math Grade 7 Answers Module 10 Answer Key Question 1.
1\(\frac{9}{10}\) ____
Answer:
Write mixed number as sum of one and his fraction.
1\(\frac{9}{10}\) = 1 + \(\frac{9}{10}\)
centering Write one as
1 + \(\frac{9}{10}\) = \(\frac{10}{10}\) + \(\frac{9}{10}\)
For a sum of this two fractions: Denominator is the same for this two fractions so rewrite it. Numerator is a sum of
both numerators.
\(\frac{10}{10}\) + \(\frac{9}{10}\) = \(\frac{10+9}{10}\) = \(\frac{19}{10}\)

Question 2.
2\(\frac{3}{4}\) ____
Answer:
Write mixed number as a sum of ones and his fraction.
2\(\frac{3}{4}\) = 1 + 1 + \(\frac{3}{4}\)
centering Write one like \(\frac{4}{4}\)
1 + 1 + \(\frac{3}{4}\) = \(\frac{4}{4}\) + \(\frac{4}{4}\) + \(\frac{3}{4}\)
Denominator is the same of this four fractions so rewrite it. Numerator is a sum of numerators of this four fractions.
\(\frac{4}{4}\) + \(\frac{4}{4}\) + \(\frac{3}{4}\) = \(\frac{4+4+3}{4}\)
= \(\frac{11}{4}\)

Question 3.
4\(\frac{1}{6}\) ____
Answer:
Write mixed number as sum of ones and his fraction
4\(\frac{1}{6}\) = 1 + 1 + 1 + 1 + \(\frac{1}{6}\)
centering Write one like \(\frac{6}{6}\).
1 + 1 + 1 + 1 + \(\frac{1}{6}\) = \(\frac{6}{6}\) + \(\frac{6}{6}\) + \(\frac{6}{6}\) + \(\frac{6}{6}\) + \(\frac{1}{6}\)
Denominator is the same for this five fractions so rewrite it Numerator is a sum of numerators for this five fractions.
\(\frac{6}{6}\) + \(\frac{6}{6}\) + \(\frac{6}{6}\) + \(\frac{6}{6}\) + \(\frac{1}{6}\) = \(\frac{6+6+6+6+1}{6}\)
= \(\frac{25}{6}\)

Module 10 Form A Module Test Answer Key Question 4.
7\(\frac{2}{9}\) ____
Answer:
Mixed number write like sum of ones and his fraction
Texas Go Math Grade 7 Module 10 Answer Key 8

Use Repeated Multiplication
Texas Go Math Grade 7 Module 10 Answer Key 3

Find each product.

Question 5.
8 × 8 × 8
Answer:
Texas Go Math Grade 7 Module 10 Answer Key 9
centering Find a product of two numbers on the box
8 . 8 = 64
centering Multiply the result by the third number
64 . 8 = 512

Question 6.
5 × 5 × 5
Answer:
Texas Go Math Grade 7 Module 10 Answer Key 10
centering Multiply the first two numbers.
5 . 5 = 25
centering Multiply the result by the third number
25 . 5 = 125

Surface Area Texas Module 10 Go Math Question 7.
5.1 × 5.1 × 5.1
Answer:
Multiply the first two numbers
Texas Go Math Grade 7 Module 10 Answer Key 11
Multiply the result by the third number.
Texas Go Math Grade 7 Module 10 Answer Key 12

132.651 ≈ 132.7

Question 8.
4 × 4 × 4 × 4
Answer:
Texas Go Math Grade 7 Module 10 Answer Key 13
centering Find a product of two number on the box.
4 . 4 = 16
centering Multiply the result by the third number
16 . 4 = 64

Multiply Fractions

Texas Go Math Grade 7 Module 10 Answer Key 4

Multiply. Write each product in simplest form.

Question 9.
\(\frac{1}{2}\) × \(\frac{1}{3}\)
Answer:
Multiply numerator with numerator and denominator with denominator.
\(\frac{1}{2}\) . \(\frac{1}{3}\) = \(\frac{1 \cdot 1}{2 \cdot 3}\)
= \(\frac{1}{6}\)

Question 10.
\(\frac{3}{4}\) × \(\frac{5}{6}\)
Answer:
Multiply numerator with numerator and denominator with denominator.
Texas Go Math Grade 7 Module 10 Answer Key 14

Module 10 Form B Module Test Answer Key Question 11.
\(\frac{9}{10}\) × \(\frac{15}{16}\)
Answer:
Multiply numerator with numerator and denominator with denominator.
Texas Go Math Grade 7 Module 10 Answer Key 15

Question 12.
\(\frac{2}{5}\) × \(\frac{5}{12}\)
Answer:
Multiply numerator with numerator and denominator with denominator.
Texas Go Math Grade 7 Module 10 Answer Key 16

Question 13.
\(\frac{4}{7}\) × \(\frac{3}{16}\)
Answer:
Multiply numerator with numerator and denominator with denominator.
Texas Go Math Grade 7 Module 10 Answer Key 17

Question 14.
\(\frac{5}{12}\) × \(\frac{3}{20}\)
Answer:
Multiply numerator with numerator and denominator with denominator.
Texas Go Math Grade 7 Module 10 Answer Key 18

Question 15.
\(\frac{3}{8}\) × \(\frac{3}{5}\)
Answer:
Multiply numerator with numerator and denominator with denominator
\(\frac{3}{8}\) . \(\frac{3}{5}\) = \(\frac{3 \cdot 3}{8 \cdot 5}\)
= \(\frac{9}{40}\)

Module 10 Mathematics Grade 7 Answer Key Question 16.
\(\frac{5}{9}\) × \(\frac{7}{10}\)
Answer:
Multiply numerator with numerator and denominator with denominator.
Texas Go Math Grade 7 Module 10 Answer Key 19

Texas Go Math Grade 7 Module 10 Reading Start-Up Answer Key

Visualize Vocabulary
Use the ✓’ words to complete the graphic. You will put one word in each oval.

Texas Go Math Grade 7 Module 10 Answer Key 5

Understand Vocabulary

Match the term on the left to the correct expression on the right.

Texas Go Math Grade 7 Module 10 Answer Key 7
Answer:
1. Lateral faces – Parallelograms that form the sides of a prism and connect the bases.
2. Surface area – The sum of alt of the areas of all of faces of a prism.
3. Lateral area – The sum of the areas of all lateral faces in a prism.

Active Reading

Booklet Before beginning the module, create a booklet to help you learn the concepts in this module. Write the main idea of each lesson on one page of the booklet. As you study each lesson, write important details that support the main idea, such as vocabulary and formulas. Refer to your finished booklet as you work on assignments and study for tests.
Texas Go Math Grade 7 Module 10 Answer Key 6

Texas Go Math Grade 7 Module 10 Answer Key Volume and Surface Area Read More »

Scroll to Top