Texas Go Math Grade 5 Unit 6 Answer Key Personal Financial Literacy
Refer to our Texas Go Math Grade 5 Answer Key Pdf to score good marks in the exams. Test yourself by practicing the problems from Texas Go Math Grade 5 Unit 6 Answer Key Personal Financial Literacy.
Texas Go Math Grade 5 Unit 6 Answer Key Personal Financial Literacy
Show what you know.
check your understanding of important skills.
Subtract multi-digit numbers subtract
Question 1.

Answer:

Explanation:
Perform subtraction operation on above two multi digit numbers. Subtract 16,897 from 18,956 then the difference is 2,059.
Question 2.

Answer:

Explanation:
Perform subtraction operation on above two multi digit numbers. Subtract 29,368 from 35,214 then the difference is 5,846.
Financial Literacy Grade 5 Answer Key Question 3.
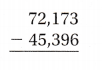
Answer:
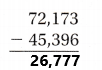
Explanation:
Perform subtraction operation on above two multi digit numbers. Subtract 45,396 from 72,173 then the difference is 26,777.
Multiply 3-Digit and 4-Digit Numbers by 1-Digit Numbers. Multiply.
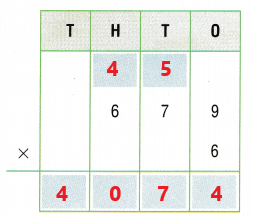
- Question 4.
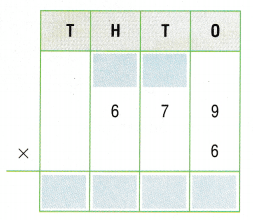
Answer:
Explanation:
Perform multiplication operation on three digit number 679 and single digit number 6. - Multiply the single digit number 6 with the digit in ones place in three digit number which is 9. Hence the product is 54. Write 4 in the ones place of the result and 5 on the top of tens place above the three digit number.
- Multiply the single digit number 6 with the digit in tens place in three digit number which is 7. Hence the product is 42. Now add 5 which we got in the last step to 42 which gives us 47. Write 7 in the tens place of the result and 4 on the top of hundredth place above the three digit number.
- Multiply the single digit number 6 with the digit in hundredth place in three digit number which is 6. Hence the product is 36. Now add 4 which we got in the last step to 36 which gives us 40. As there are no other digits in the three digit number to multiply, write the total sum 40 in the hundredth place in the result.
Question 5.
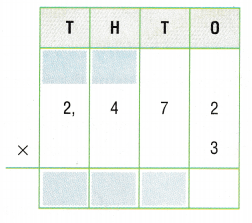
Answer:

Explanation:
- Perform multiplication operation on four digit number 2,472 and single digit number 3.
- Multiply the single digit number 3 with the digit in ones place in four digit number which is 2. Hence the product is 6. Write 6 in the ones place of the result.
- Multiply the single digit number 3 with the digit in tens place in four digit number which is 7. Hence the product is 21. Write 1 in the tens place of the result and 2 on the top of hundredth place above the four digit number.
- Multiply the single digit number 3 with the digit in hundredth place in four digit number which is 4. Hence the product is 12. Now add 2 which we got in the last step to 12 which gives us 14. Write 4 in the hundredth place of the result and 1 on the top of thousands place above the four digit number.
- Multiply the single digit number 3 with the digit in thousands place in four digit number which is 2. Hence the product is 6. Now add 1 which we got in the last step to 6 which gives us 7. As there are no other digits in the four digit number to multiply, write the total sum 7 in the thousands place in the result.
Add Decimals Estimate. Then find the sum.
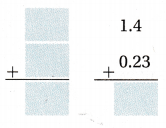
Question 6.
Estimate:
Answer:
Explanation:
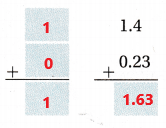
For Estimation:
If the digit after decimal in a number is greater than or equal to 5, then we need to add 1 to the number before the decimal. If the digit after decimal in a number is less than 5, then only the number before decimal is considered. So, 1.4 is estimated as 1 and 0.23 is estimated as 0. So the sum is 1 + 0 = 1.
For finding the total sum without estimation:
Add these two decimal numbers 1.4 and 0.23 the sum is 1.63.
Financial Literacy Answer Key 5th Grade Question 7.
Estimate:

Answer:

Explanation:
For Estimation:
If the digit after decimal in a number is greater than or equal to 5, then we need to add 1 to the number before the decimal. If the digit after decimal in a number is less than 5, then only the number before decimal is considered. So, 1.78 is estimated as 2 and 0.13 is estimated as 0. So the sum is 2 + 0 = 2.
For finding the total sum without estimation:
Add these two decimal numbers 1.78 and 0.13 the sum is 1.91.
Question 8.
Estimate:

Answer:

Explanation:
For Estimation:
If the digit after decimal in a number is greater than or equal to 5, then we need to add 1 to the number before the decimal. If the digit after decimal in a number is less than 5, then only the number before decimal is considered. So, 1.38 is estimated as 1 and 1.21 is estimated as 1. So the sum is 1 + 1 = 2.
For finding the total sum without estimation:
Add these two decimal numbers 1.38 and 1.21 the sum is 2.59.
Vocabulary Builder
Visualize it
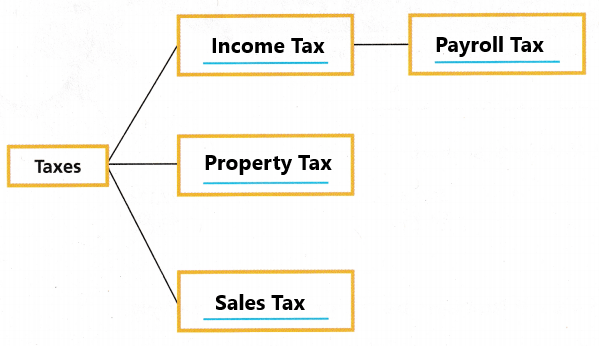
Use the ✓ words to complete the tree map.
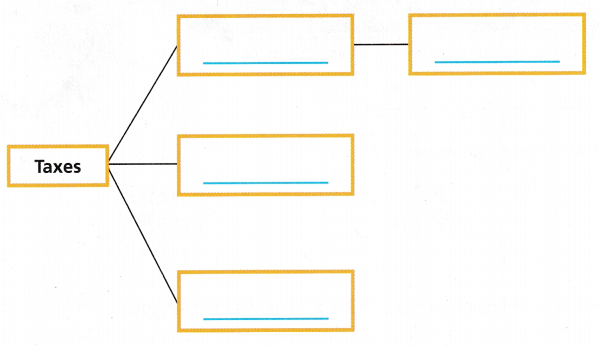
Answer:
Understand Vocabulary
Complete the sentences using the preview words.
Question 1.
A ___ is a fee paid to the government in return for goods and services, such as roads and police protection.
Answer:
A Income tax is a fee paid to the government in return for goods and services, such as roads and police protection.
Personal Financial Literacy Unit Test Answer Key Question 2.
____ is the amount of income left after taxes are taken out of the ____.
Answer:
Net income is the amount of income left after taxes are taken out of the Gross income.
Question 3.
____ is the tax withheld from an employee’s paycheck.
Answer:
Payroll tax is the tax withheld from an employee’s paycheck.
Question 4.
A ____ is an identification card issued by a bank that allows a user to immediately use money from an account.
Answer:
A Debit card is an identification card issued by a bank that allows a user to immediately use money from an account.
Question 5.
A bank may charge interest on the amount of money charged on a ____
Answer:
A bank may charge interest on the amount of money charged on a credit card.
Question 6.
You can write a ____ to pay for a purchase using money in your bank account.
Answer:
You can write a Check to pay for a purchase using money in your bank account.
Reading & Writing Math
Reading When you read a story, you can tell what an unfamiliar word means by the situation being described. When you read about financial matters, you may see a familiar word used in different ways. You may also need to use the situation to understand the word’s meaning.
Look at the word tax in each of the following situations. Which meaning of the word is used in each sentence? Write the letter of the definition.
• John and Maria live in a big city. They pay tax to the city based on how much they earn. ____
Answer:
John and Maria live in a big city. They pay tax to the city based on how much they earn. The tax is Income tax.
Income tax is based on the amount of money we earn or our income. Federal income tax is paid to the united states government. Some states and cities also have an income tax. Workers throughout the united states pay federal income tax, but state or city income taxes vary across the country.
• Marcia bought a new coat and hat. She paid $102.96 for the items and $8.49 tax. _____
Answer:
Marcia bought a new coat and hat. She paid $102.96 for the items and $8.49 tax. The tax is sales tax.
Sales tax is money added to the cost of items or services.
• Kati received her paycheck. Her pay stub showed a total of $67.45 in taxes. _____
Answer:
Kati received her paycheck. Her pay stub showed a total of $67.45 in taxes. The tax is Payroll tax.
Payroll tax is money an employer withholds from an employee’s earnings.
• The Petersens received a notice that their tax would increase because of the new garage they put on their house. _____
Answer:
The Petersens received a notice that their tax would increase because of the new garage they put on their house. The tax is property tax.
Property tax is a portion of the value of items that is paid to a city or state government. Property tax can be charged on things such as cars, houses, boats, or land.
A. Payroll tax is money an employer withholds from an employee’s earnings.
B. Income tax ¡s the money paid to a city, town, or state government or to the U.S. government (called federal income tax).
C. Sales tax is money added to the cost of items or services.
D. Property tax is a portion of the value of items that is paid to a city or state government. Property tax can be charged on things such as cars, houses, boats, or land.

Writing Choose one of the definitions of tax and write your own sentence using the word tax. Exchange sentences with a partner and guess the meaning of the word. Then work together to write a math problem based on one of your sentences.
Get Ready Game
Budget Balance Bingo
Object of the Game be the first to balance your budget.
Materials
- Number cube labeled 1, 2, 3, 4, 5 and X
- Number cube labeled Red, Blue, Yellow, Green, Orange, and X
- Counters
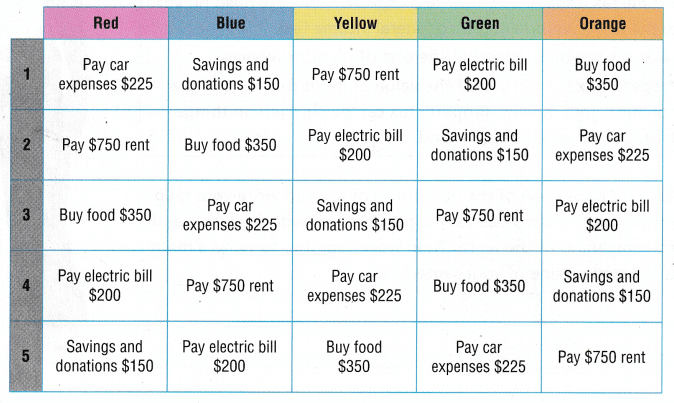
- Budget Balance Game Card

Set Up
Give each player a copy of the game card and some counters. All players begin with $1,675 earnings in their budget.
Number of Players 2 or more
How to Play
Question 1.
Each player rolls both number cubes and places a counter on the square named by the color and number. If an X is rolled, the player loses a turn.
Answer:
Question 2.
The first player to cover all the squares in the same row or column has balanced the budget and wins the game.
Answer:
5th Grade Financial Literacy Answer Key Question 3.
Variation: Players record each difference as they subtract each expense rolled. They can subtract an expense listed in any square they have covered but cannot subtract the same expense twice. The winner is the person who balances the budget first, even if the squares covered are not all in the same row or column.
Answer:
Texas Go Math Grade 5 Unit 6 Answer Key Personal Financial Literacy Read More »