Texas Go Math

Texas Go Math Grade 7 Lesson 14.1 Answer Key Personal Budgets

Refer to our Texas Go Math Grade 7 Answer Key Pdf to score good marks in the exams. Test yourself by practicing the problems from Texas Go Math Grade 7 Lesson 14.1 Answer Key Personal Budgets.

Texas Go Math Grade 7 Lesson 14.1 Answer Key Personal Budgets

Texas Go Math Grade 7 Lesson 14.1 Explore Activity 1 Answer Key

Identifying the Components of a Personal Budget

It can be tough to reach a long-term goal without making a plan for how to get there. A budget is a plan to help you reach your financial goals.

Some of the components of a budget are income, or the amount of money you earn, and expenses, or how much you spend. Expenses can include planned savings for college, retirement, emergencies, and taxes.
The goal of a budget is to spend no more than you earn, and save some additional money if you can.

Jenna is saving for a tablet for college. She is making a 4-week budget. The budget shows her total income and the various expenses she has, including saving for the tablet.

Step 1
Enter the total amount that Jenna will earn babysitting for 4 weekends in the table.
Texas Go Math Grade 7 Lesson 14.1 Answer Key 1
Step 2
Enter Jenna’s expenses and planned savings in the Expenses column.
Expenses: entertainment—$15 snacks—$10
Planned savings: college fund—$20 tablet—$25
Step 3
Complete the Amount Available column by adding each row of income and subtracting each row of expenses.
How much money does Jenna have available at the end of 4 weeks? What could she do with it?
Answer:

Reflect

Texas Go Math Grade 7 Lesson 14.1 Planning A Budget Question 1.
What If? What if Jenna misses a weekend babysitting? How would that affect the budget?
Answer:
Fixed expenses: guitar rental fee, saving for car, emergency saving.
Variable expenses: clothes, entertainment
Adding aLL the cost from the given table
Fixed expense = 15 + 30 + 10
= $55
Variable expense = 40 + 50
= $90

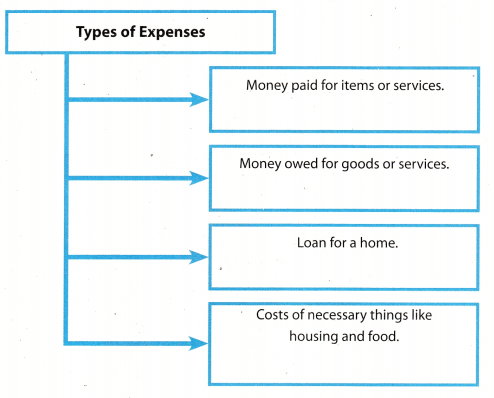
Identifying Types of Expenses

There are two different types of expenses: fixed expenses and variable expenses. Fixed expenses, such as car and house payments, occur regularly and do not change from month to month. A variable expense, such as purchases of food or gas, occurs regularly and is necessary for living, but you have some control over the amount.

Example 1.
A. The table shows Garrett’s monthly budget. To earn money, he mows lawns. Identify Garrett’s fixed and variable expenses.
Texas Go Math Grade 7 Lesson 14.1 Answer Key 2
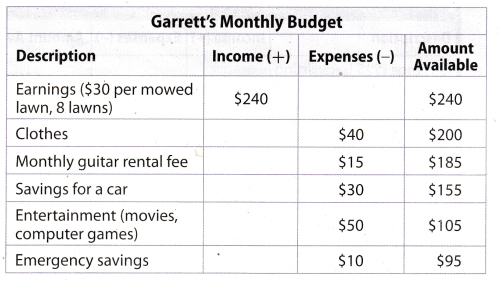
Fixed expenses: guitar rental fee, savings for a car, emergency savings
Variable expenses: clothes, entertainment

B. The table shows Mrs. Everdeen’s monthly budget. Identify Mrs. Everdeen’s fixed and variable expenses.
Texas Go Math Grade 7 Lesson 14.1 Answer Key 3
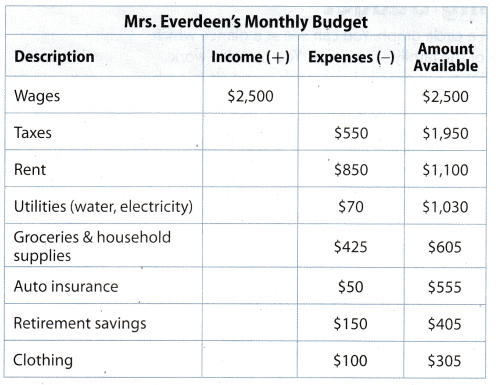
Fixed expenses: taxes, retirement savings, rent, auto insurance Variable expenses: utilities, groceries and household supplies, clothing

Reflect

Question 2.
How are these budgets different?
Answer:
Fixed expenses : taxes, retirenient savings, rent, auto insurance.
Variable expenses : utilities, groceries. clothing.
Adding all the cost from the given table
Fixed expense = 550 + 150 + 850 + 50
= $1600
Variable expense = 70 + 125 + loo
= $595
In this budget $550 is given as taxes which is calculated as the fixed expenses, but the tax expense will depend upon tile amount wages or income which Mr. Everdeen gets each month. And the end of month he is left with $305 after all expenses.

Your Turn

Question 3.
Mallina is making a budget. The table shows the categories of expenses in her budget. In the second column of the table, use an F to mark fixed expenses and a V to mark variable expenses.
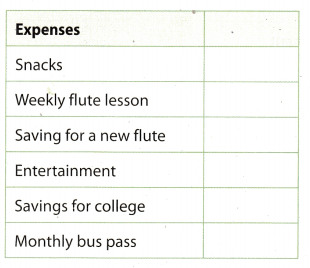
Texas Go Math Grade 7 Lesson 14.1 Answer Key 4
Answer:
Texas Go Math Grade 7 Lesson 14.1 Answer Key 14
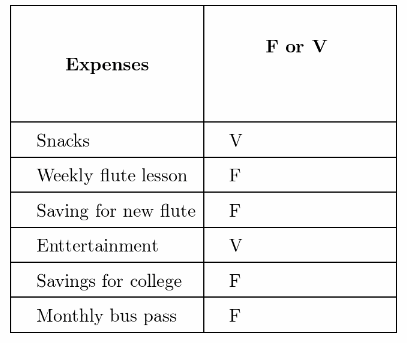
snacks and entertainment are variable expenses.

Texas Go Math Grade 7 Lesson 14.1 Explore Activity 2 Answer Key

Analyzing a Family Budget

One way to present a budget is in a circle graph. You can see at a glance which categories take the greatest part of the family’s resources. You can also work backward from a circle graph to figure out exactly how much money is in each category.

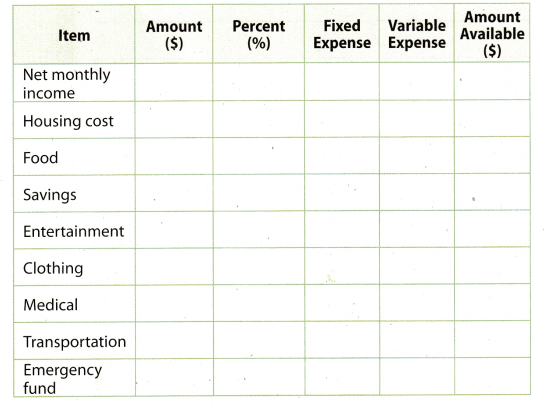
Use the circle graph to complete the table for the Baker family’s monthly budget. Their net monthly income is $4,000.
Texas Go Math Grade 7 Lesson 14.1 Answer Key 5

Step 1: Enter the income in the table.
Step 2: Enter the percent or amount of money for each category from the circle graph in the table.
Step 3: Calculate the amount of money or the percent for each category in the table.
Step 4: Determine which expenses are fixed and which are variable. Place X’s in the appropriate columns.
Step 5: Complete the Amount Available column.
Texas Go Math Grade 7 Lesson 14.1 Answer Key 6

Reflect

Question 4.
Analyze Relationships One month, the family must make an emergency car repair for $305. Are they able to pay for it out of the fixed emergency fund for that month? If not, how can they afford it?
Answer:
Given net monthly income of Baker famiLy = $4, 000
Percentage of budget for emergency fund = 5%
Cost of emergency car repair = $305
So, amount for emergency fund = \(\frac{5}{100}\) × 4, 000
= 0.05 × 4000
= $200
The cost of emergency car repair is 305 but he has only $200 in his emergency fund. So he will not able to pay whole amount from emergency fund. Hence, he will need to take extra amount 305 – 200 = $ 105 from saving to pay the car repair cost.

Question 5.
The family wants to make a trip to Houston to visit the NASA Space Center. What are some ways they can save without using all of the allotted $160 for entertainment?
Answer:
While on trip to Houston to visit NASA space centre. the ways in which family can save without using ail the allotted $160 for entertainment are reducing their variable expenses such as :

  1. Food expenses
  2. Clothing expenses

YOUR TURN

For 6-8, use the circle graph of the Torres family’s monthly budget. Their net monthly income is $4,500.

Texas Go Math Grade 7 Lesson 14.1 Answer Key 7

Question 6.
How much does the Torres family Medical spend on housing each month?
Answer:
Net monthly income of the Torres family = $4. 500
Percentage of budget a Lotted for housing = 30%
Amount for housing = \(\frac{\text { Percent }}{100}\) × Total amount
Amount for housing = \(\frac{30}{100}\) × 4500
= 0.3 × 4500
= $1350
Hence, the amount allotted each month for housing is 1350
The amount allocated each month for housing is 1350

Go Math Grade 7 Lesson 14.1 Independent Practice Answer Key Question 7.
What percent of the budget does the Torres family spend on food? clothing?
Answer:
Net monthly income of the Torres family = $4. 500
Amount spent on food each month = $630
Amount spent on clothing each month = $360
Texas Go Math Grade 7 Lesson 14.1 Answer Key 15
= 0.14 × 100
= 14%
For clothing = \(\frac{360}{4500}\) × 100
= 0.08 × 100
= 8%
Hence, 14% of budget is spent on food and 8% on clothing
14% of budget is spent on food and 8% on clothing

Question 8.
During a thunderstorm, lighting strikes a large tree in the Torres family’s backyard. The tree needs to be removed. The cost to remove the tree is $500. Is there enough money budgeted in the allotted emergency fund? Explain. If not, how much more does the family need, and how could they find the money for it?
Answer:
Given net monthly income of Torres family = $4, 500
Percentage of budget for emergency fund = 4%
Percentage of budget for saving fund = 10%
Cost to remove tree from backyard = $500
So, amount for emergency fund = \(\frac{4}{100}\) × 4, 500
= 0.04 × 4500
= $180
Amount for saving fund \(\frac{10}{100}\) × 4. 500
= 0.1 × 4500
= $450

The cost of removing tree is 500 but he has only $ 180 in his emergency fund. So he will not able to pay whole amount from emergency fund. Hence, he will need to take an extra amount of 500 – 180 = $ 320 from saving to pay for removing tree from the background.
An extra $320 is needed from saving to pay for removing the tree

Texas Go Math Grade 7 Lesson 14.1 Guided Practice Answer Key 

Sofia is creating a budget to save $250 for a week of soccer camp. She earns money by working as a mother’s helper on Saturday mornings and Wednesday afternoons. She earns $20 each time she works. She wants to save $12.50 a week for the camp. Her mother wants her to save $5 a week for college. She is planning on spending $5 a week for snacks and $10 a week for entertainment.

Question 1.
Complete the table. (Explore Activity 1)
Texas Go Math Grade 7 Lesson 14.1 Answer Key 8
Answer:
Texas Go Math Grade 7 Lesson 14.1 Answer Key 16
Texas Go Math Grade 7 Lesson 14.1 Answer Key 17
Total income of a month is $ 160

Question 2.
Circle the variable expenses in Sofia’s budget. (Example 1)
Answer:
The Variable expenses of the Sofia’s 4-week budget are
Snacks = $20
Entertainment = $40
The Fixed expenses of the Sofia’s 4-week budget are:
Saving for soccer camp = $50
Saving for college = $20
Hence, total variabLe expenses is 20 + 40 = $60
Total variable expenses is $60

Question 3.
If Sofia decides to take piano lessons at the community center for $5 a week, would that be a fixed expense or a variable expense?
________ (Example 1)
Answer:
Fixed expense

If Sofia decides to take Piano lessons at the community centre for the $5 then this cost will be regarded as the fixed expanse. Because every week Sofia has to pay $5 at community centre. And this cost will be fixed, which will not change once Sofia is enrolled for classes. So total Sofia has to pay $20 in a month.

For 4-5, use the circle graph of the Talbot family’s Talbot monthly budget. Their monthly income is $3,200. (Explore Activity 2)
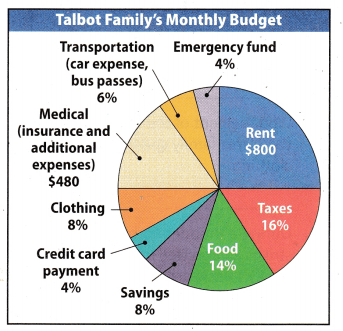
Texas Go Math Grade 7 Lesson 14.1 Answer Key 9

Question 4.
What percent of the Talbot family budget is 6 spent on rent? _______________________________
Answer:
Net monthly income of the Talbot family = $3. 200
Amount of budget allotted for rent = $800
Texas Go Math Grade 7 Lesson 14.1 Answer Key 18
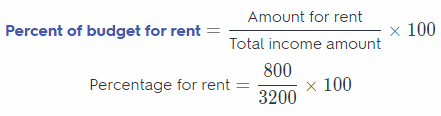
= \(\frac{1}{4}\) × 100
= 25%
Mence, trie percentage of budget allotted each month for rent is 25%
Percentage of budget allotted each month for rent is 25%

Personal Budgets Lesson 14.1 Answer Key Grade 7 Question 5.
If the Talbots did not have to make a credit card payment, and instead put that money into savings, how much would they be able to save each month? _________________________
Answer:
Net monthly income of the Talbot family = $3,200
Percentaget of budget allotted for credit card = 4%
Percentaget of budget allotted for saving = 8%
Amount of budget for credit card = \(\frac{\text { Percent }}{100}\) × Total monthly income
Amount allotted for credit Savings = \(\frac{4}{100}\) × 3, 200
= 0.04 × 3200
= $128
Amount alloted for savings = \(\frac{8}{100}\) × 3,200
= 0.08 × 3200
= $ 256
Total saving in month = 128 + 256 = $384
Hence, the total saving of the month is $384
Total saving in a month is $384

Essential Question Check-in

Question 6.
How does a budget help an individual or a family manage their finances?
Answer:
Budget helps an individual or a family manage their finance in many ways such as when there is an emergency need of money, than in that tough situation we are able to manage that amount from the emergency fund of the budget. Also when there is something we want to buy in future like car, house, etc for that also we can fix a small percentage from our budget to achieve that. So simply budget makes us the worry free in month.
Budget makes the individual or family burden free.

Texas Go Math Grade 7 Lesson 14.1 Independent Practice Answer Key  

For 7-8, use the table.
Texas Go Math Grade 7 Lesson 14.1 Answer Key 10

Question 7.
Complete the Amount Available column in the table.
Answer:
Texas Go Math Grade 7 Lesson 14.1 Answer Key 19
Texas Go Math Grade 7 Lesson 14.1 Answer Key 20
saving after all expense is $145

Question 8.
The swim camp costs $280. How long will it take Kareem to save enough for the camp? Show your work.
Answer:
Given total cost of swim camp = $280
Saving of Kareem for swimming camp per month = $40
Texas Go Math Grade 7 Lesson 14.1 Answer Key 21
= 7
Hence, it will take 7 months to save enough money for camp
7 months

For 9-12, use the circle graph for the Moore family’s monthly budget. Their monthly income is $5,000.

Texas Go Math Grade 7 Lesson 14.1 Answer Key 11

Question 9.
What percent of the Moore’s income goes to taxes?
Answer:
Net monthLy income of the Moore’s family = $5, 000
Amount that goes for the taxes = $850
Texas Go Math Grade 7 Lesson 14.1 Answer Key 22
= 0.17 × 100
= 17%
Hence, the percentage of income that goes to taxes is 17%
Percentage of income that goes to taxes is 17%

Question 10.
How much does the Moore family spend each year on insurance?
Answer:
Net monthly income of the Moore family = $5, 000
Percentage of budget allotted for insurance = 12%
Amount of budget for insurance = \(\frac{\text { Percent }}{100}\) × Total monthly income
Amount allotted for insurance each month = \(\frac{12}{100}\) × 5,000
= 0.12 × 5000
= $600
Yearly spending of Moore famiLy on insurance = 12 × Monthly spending
Yearly spending on insurance = 12 × 600 = $7, 200

Question 11.
Draw Conclusions Emily says that the Moore family spends $300 more on recreation than on transportation. Is she right? Explain.
Answer:
Net monthly income of the Moore’s family = $5, 000
Amount that spent on recreation = $500
Percentage go budget spent on transportation = 6%
Amount of budget for transportation = \(\frac{\text { Percent }}{100}\) × Total income amount
Amount for transportation = \(\frac{6}{100}\) × 5,000
= 0.06 × 5,000
= $300
Difference in amount = Recreation – Transportation = 500 – 300 = $200
So, Emily is not correct because Moore’s family spends $200 more on recreation than on transportation, not $300 as
Hence, the percentage of income that goes to taxes is 17%
No, Emily is not correct.

Budgeting Math Problems Lesson 14.1 Answer Key Question 12.
Communicate Mathematical Ideas. Moore’s monthly income increases by $500, but the mortgage expense stays the same. Explain how to find what percent of the budget the mortgage payment would now be.
Answer:
Initially monthly income of Moore’s family = $5, 000
Amount of increase in monthly income = $500
Percentage of budget for mortgage = 22%
It is given in the problem that the mortgage expense remains the same even after there is increase of $500 in monthly income
Amount of mortgage expense = \(\frac{22}{100}\) × 5,000
= 0.22 × 5,000
= $1100
New monthly income of Moore’s family 5000 + 500 = $5, 500
New percentage mortgage expense = \(\frac{1100}{5,500}\) × 100
= \(\frac{100}{5}\)
= 20%
Hence, the new percentage of mortgage expense is 20%
The new percentage of mortgage expense is 20%

H.O.T. Focus on Higher Order Thinking

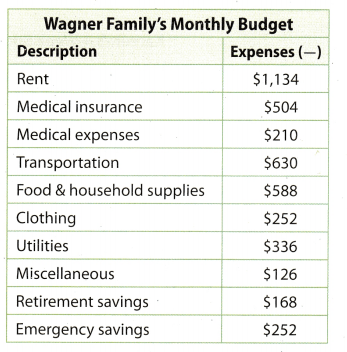
The circle graph shows the Rivera family’s monthly budget. Their monthly income is $4,500. The table shows the budget for the Wagner family. Their monthly income is $4,200.
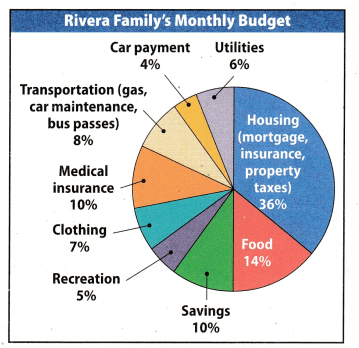
Texas Go Math Grade 7 Lesson 14.1 Answer Key 12

Texas Go Math Grade 7 Lesson 14.1 Answer Key 13

Question 13.
Analyze Relationships Which family pays a greater part of their income for transportation (including car payments)? Explain your conclusion.
Answer:
Monthly income of the Rivera family = $4. 500
Percentage of budget for transportation = 8%
Percentage of budget for Car payment = 4%
Amount spent on transportation = \(\frac{8}{100}\) × 4, 500
= 0.08 × 4.500
= $360
Amount spent on Car payment = \(\frac{4}{100}\) × 4, 500
= 0.04 × 4.500
= $180
Total Money spent by Rivera family on transportation = 360 + 180 = $540
Total Money spent by the Wagner family on transportation = $630
Hence, the Wagner family spends more on transportation as compared to the Rivera family.
The Wagner family spends more on transportation as compared to the Rivera family.

Question 14.
Multistep Over a year, which family pays more for medical insurance? How much more?
Answer:
Monthly income of the Rivera family = $4, 500
Percentage of budget medical insurance = 10%
Amount spent on Medical insurance = \(\frac{10}{100}\) × 4, 500
= 0.1 × 4,500
= $450
Rivera family spending on Medical insurance in year = 12 × 450 = $5. 400
Wagner famiLy spending on medical insurance in year = 12 × 504 = $6,048
Difference of medical insurance spending = $6,048 – $5. 400 = $648
Hence, Wagner family pays more for medical insurance in a year and the amount is $648 more as compared to the spending of Rivera family.
Wagner family spend $648 more on medical insurance.

Question 15.
Multiple Representations Compare the two budgets. What are the advantages and disadvantages of each type of presentation?
Answer:
Advantage and disadvantage of the pie chart presentation are :

  • Pie chart represent! t lie large set of data in visual form.
  • Pie chart shows the relative proportion of data.
  • In pie chart circle is made in proportion of whole data.
  • Pie chart does not reveals the exact values.
  • If there are too many data then it becomes less effective.

Advantage and disadvantage of the tabular chart presentation are :

  • In tabular chart representation exact value of data is present.
  • In this case it becomes easy for comparing two data.
  • In tabular representation the data is not shown in proportion.
  • Also it becomes difficult to represent when there is large sets of data.

In pie chart representation of large data is easy whereas in case of tabular chat representation it is difficult.

Texas Go Math Grade 7 Lesson 14.1 Answer Key Personal Budgets Read More »

Texas Go Math Grade 7 Module 14 Answer Key Planning Your Future

Refer to our Texas Go Math Grade 7 Answer Key Pdf to score good marks in the exams. Test yourself by practicing the problems from Texas Go Math Grade 7 Module 14 Answer Key Planning Your Future.

Texas Go Math Grade 7 Module 14 Answer Key Planning Your Future

Texas Go Math Grade 7 Module 14 Are You Ready? Answer Key

Complete these exercises to review skills you will need for this chapter.

Compare. Write. > or <.

Question 1.
4.051 Texas Go Math Grade 7 Module 14 Answer Key 1 4.501
Answer:
In the given problem, we have to find out which is greater 4.051 or 4.501
To find which one is greater we will plot both given numbers on the number line and among the given two, the number on the right side of the number line will be greater than the number on the left side of the number line.
So, 4.051 < 4.501
Texas Go Math Grade 7 Module 14 Answer Key 13

Texas Go Math Grade 7 Solutions Module 14 Answer Key Question 2.
73.090 Texas Go Math Grade 7 Module 14 Answer Key 1 73.089
Answer:
In given problem we have to find out which is greater 73.090 or 73.089
To find which one greater we will plot both given number on the number line and among the given two, the number which on the right side of number line will be greater than the number which on the left side of number line.
So, 73.090 > 73.089
Texas Go Math Grade 7 Module 14 Answer Key 14

Find each product.

Question 3.
Texas Go Math Grade 7 Module 14 Answer Key 2
Answer:
Given in problem: 716 × 12
Texas Go Math Grade 7 Module 14 Answer Key 15
716 × 12 = 8592

Grade 7 Go Math Module 14 Answer Key Question 4.
Texas Go Math Grade 7 Module 14 Answer Key 3
Answer:
Given in problem 491 × 31
Texas Go Math Grade 7 Module 14 Answer Key 16

Question 5.
Texas Go Math Grade 7 Module 14 Answer Key 4
Answer:
Given in problem 608 × 35
Texas Go Math Grade 7 Module 14 Answer Key 17

Question 6.
Texas Go Math Grade 7 Module 14 Answer Key 5
Answer:
Given in problem 449 × 52
Texas Go Math Grade 7 Module 14 Answer Key 18

Find each percent.

Question 7.
40% of 30 ________
Answer:
Given in problem: 40% of 30
We know that value of percentage = \(\frac{\text { Percent }}{100}\) × Total value
40% of 30 = \(\frac{40}{100}\) × 30
= 0.4 × 30
= 12

Go Math Grade 7 Answer Key Pdf Module 14 Question 8.
9% of 26 _________
Answer:
Given in problem: 9% of 26
We know that value of percentage = \(\frac{\text { Percent }}{100}\) × Total value
9% of 26 = \(\frac{9}{100}\) × 26
= 0.09 × 26
= 2.34

Question 9.
48% of 130 _________
Answer:
Given in problem: 48% of 130
We know that value of percentage = \(\frac{\text { Percent }}{100}\) × Total value
48% of 130 = \(\frac{48}{100}\) × 130
= 0.48 × 130
= 62.4

Question 10.
66% of 29 _______
Answer:
Given in problem: 66% of 29
We know that value of percentage = \(\frac{\text { Percent }}{100}\) × Total value
66% of 29 = \(\frac{66}{100}\) × 29
= 0.66 × 29
= 19.14

Question 11.
140% of 12 _______
Answer:
Given in problem: 140% of 29
We know that value of percentage = \(\frac{\text { Percent }}{100}\) × Total value
140% of 29 = \(\frac{140}{100}\) × 12
= 1.4 × 12
= 16.8

Module 14 Go Math Grade 7 Answer Key Pdf Question 12.
100% of 584 _______
Answer:
Given in problem: 100% of 584
We know that value of percentage = \(\frac{\text { Percent }}{100}\) × Total value
100% of 584 = \(\frac{100}{100}\) × 584
= 1 × 584
= 584

Texas Go Math Grade 7 Module 14 Reading Start-Up Answer Key

Visualize Vocabulary

Use the ✓ words to complete the graphic. You will put a different one in each box.

Texas Go Math Grade 7 Module 14 Answer Key 6

Understand Vocabulary

Complete each sentence, using the preview words.

Question 1.
____________________ occur regularly and stay the same.
Answer:
Fixed Expenses occur regularly and stay the same

Question 2.
A plan to help you reach your financial goals is a _________
Answer:
A plan to help you reach your financial goals is a budget

Texas Go Math Grade 7 Module 14 Answer Key Planning Your Future Read More »

Texas Go Math Grade 7 Module 12 Quiz Answer Key

Refer to our Texas Go Math Grade 7 Answer Key Pdf to score good marks in the exams. Test yourself by practicing the problems from Texas Go Math Grade 7 Module 12 Quiz Answer Key.

Texas Go Math Grade 7 Module 12 Quiz Answer Key

Texas Go Math Grade 7 Module 12 Ready to Go On? Answer Key

12.1 Populations and Samples

Question 1.
A company uses a computer to identify their 600 most loyal customers from its database and then surveys those customers to find out how they like their service. Identify the population and determine whether the sample is random or biased.
Answer:
It is given in the problem that company uses the database from computer to identify their 600 most loyal customers so here all the customers in database will be Population and 600 loyal costumers will be the sample.
Also it is mentioned that company are identifying the 600 most loyal costumers so the sample will be biased sample. Because the identification of loyal costumers will be done on certain condition, hence each customer will not get equal chance for being loyal costumer.

All the customers in the database will be population.

12.2 Making Inferences from a Random Sample

7th Grade Go Math Answer Key Module 12 Answer Key Question 2.
A university has 30,330 students. In a random sample of 270 students, 18 speak three or more languages. Predict the number of students at the university who speak three or more languages. ____
Answer:
Total number of students in university = 30,330
Number of students in random sample = 270
Number of students who speak 3 or more Language = 18
Texas Go Math Grade 7 Module 12 Quiz Answer Key 5
Hence, 2,022 students in university can speak 3 or more language.

12.3 Comparing Populations

Question 3.
The box plot shows data that was collected on two basketball players over 20 randomly selected games in order to analyze the number of points each player has scored per game over his career. Make an inference from this data.

Texas Go Math Grade 7 Module 12 Quiz Answer Key 1
Answer:
Comparing the Boxplot of player 1 and Player 2 :

⇒ Length of box and whisker of player 1 is smaller as compared to the player 2.
⇒ Median of points of player 1 is 27 which is less as compared to the median of player 2 is 35. This means median point of player 2 is 7 more than player 1.
⇒ Range of player 1 = 38 – 17 = 21 and the Range of player 2 = 45 – 0 = 45.
⇒ Points of player 1 are lesser spread as compared to the points of the second player.

The length of the box and whisker of Player 1 is smaller as compared to Player 2.

Essential Question

Go Math Answer Key Grade 7 Module 12 Quiz Question 4.
How can you use random samples to compare populations and make inferences?
Answer:
We can use the data from a random sample for comparing the population and making interference. Random
samples are more likely to contain data that can be used to make predictions about a whole population. The size of a sample influences the strength of the inference about the population. we can also use the proportion formula for
comparing the population.
Texas Go Math Grade 7 Module 12 Quiz Answer Key 6
Random sample can be used to compare populations.

Texas Go Math Grade 7 Module 12 Mixed Review Texas Test Prep Answer Key 

Selected Response

Question 1.
The box plot shows the results from a survey in which 50 of the school’s 7th graders were asked about their height. Which could you infer based on the box plot below?
Texas Go Math Grade 7 Module 12 Quiz Answer Key 2
(A) Most 7th graders are at least 65 inches tall.
(B) Most 7th graders are at least 54 inches tall.
(C) Almost no 7th graders are less than 60 inches tall.
(D) Almost no 7th graders are more than 60 inches tall.
Answer:
(B) Most 7th graders are at least 54 inches tall.

When we observe the given boxplot we can see that centre of box or median is 61 and the lower quartile is 54 and upper quartile is 65. Here lower quartile is 54 which means that only 25% or less 7th grade students are shorter than 54 inch. Hence at least 75% students are at least 54 inch taller So we can say that most 7th graders are at least 54 inches tall.
hence, option B is correct answer.

Question 2.
A middle school has 490 students. Mae surveys a random sample of 60 students and finds that 24 of them have pet dogs. How many students are likely to have pet dogs?
(A) 98
(B) 196
(C) 245
(D) 294
Answer:
(B) 196

Total number of students in middle school = 490
Number of students in random sample = 60
Number of students who have pet dogs = 24
Texas Go Math Grade 7 Module 12 Quiz Answer Key 7
so, 192 students in middle school have pet dogs
Hence, option B is the correct answer

Module 12 Form A Module Test Texas Go Math Grade 7 Question 3.
Caitlyn finds that the experimental probability of her making a three-point shot is 30%. Out of 500 three-point shots, about how many could she predict she would make?
(A) 100
(B) 115
(C) 125
(D) 150
Answer:
(D) 150

Experimental probability of making three-point = 30%
Total number of three-point shots = 500
Number of shots Caitlyn can predict = \(\frac{\% \text { of 3-point shots }}{100}\) × Total number of shots
= \(\frac{30}{100}\) × 500
= 0.3 × 500
= 150
So, Caitlyn can predict she would make 150 three-point shots.
Hence, option D is correct answer.

Question 4.
Which of the following is a random sample?
(A) A radio DJ asks the first 10 listeners who call in if they liked the last song.
(B) 20 customers at a chicken restaurant are surveyed on their favorite food.
(C) Members of a polling organization survey 800 registered voters by randomly choosing names from a list of all registered voters.
(D) Rebecca used an email poll to survey 100 students about how often they use the internet.
Answer:
(C) Members of a polling organization survey 800 registered voters by randomly choosing names from a list of all registered voters.

Random sample : A sample in which every person, object, or event has an equal chance of being selected is called as the Random Sample.
So incase of option C there are total 800 registered voters who are being surveyed by polling organisation but they are choosing the vote randomly from the list. Hence out of 800 voters each one has an equal chance of being selected for the survey. Thus this sample will be a random sample.
Hence, option C is correct answer.

Gridded Response

Go Math Grade 7 Module 12 Test Answer Key Question 5.
Mary wanted to know the amount of time 7th-grade students spend on homework each week, so she surveyed 20 students at random. The results are shown below.
Texas Go Math Grade 7 Module 12 Quiz Answer Key 3
There are 164 students in the 7th grade. Predict how many 7th-grade students spend 5 hours on homework in a week.
Texas Go Math Grade 7 Module 12 Quiz Answer Key 4
Answer:
Total number of students in 7th grade = 164
Number of students in random sample = 20
Texas Go Math Grade 7 Module 12 Quiz Answer Key 8
Hence, 41 students of 7th grade spends 5 hours on homework.

Steps for marking the given box:

1st column : mark ‘+’ sign
2nd column: mark ‘0’
3rd column : mark ‘0’
4th column: mark ‘4’
5th column : mark ‘1’
6th column : mark ‘0’
7th column : mark ‘0’

41 students of 7th grade spends 5 hours on homework.

Texas Go Math Grade 7 Module 12 Quiz Answer Key Read More »

Texas Go Math Grade 7 Module 12 Answer Key Random Samples and Populations

Refer to our Texas Go Math Grade 7 Answer Key Pdf to score good marks in the exams. Test yourself by practicing the problems from Texas Go Math Grade 7 Module 12 Answer Key Random Samples and Populations.

Texas Go Math Grade 7 Module 12 Answer Key Random Samples and Populations

Texas Go Math Grade 7 Module 12 Are You Ready? Answer Key
Complete these exercises to review skills you will need for this module.

Write each fraction as a decimal and a percent.

Question 1.
\(\frac{1}{2}\)
Answer:
0.5

Texas Go Math Grade 7 Module 12 Answer Key Random Samples and Populations 2

Go Math Grade 7 Answer Key Pdf Module 12 Question 2.
\(\frac{3}{4}\)
Answer:
0.75

Texas Go Math Grade 7 Module 12 Answer Key Random Samples and Populations 3

Question 3.
\(\frac{2}{5}\)
Answer:
0.4

Texas Go Math Grade 7 Module 12 Answer Key Random Samples and Populations 4

Question 4.
\(\frac{7}{10}\)
Answer:
0.7

Texas Go Math Grade 7 Module 12 Answer Key Random Samples and Populations 5

Find the range of the data.

Question 5.
52, 48, 57, 47, 49, 60, 59, 51 ____
Answer:
13

Order the data from the least to greatest.
47, 48, 49, 51, 52, 57, 59, 60
The range if the difference between the greatest and the least data values.
The range = 60 – 47 = 13

Question 6.
5, 9, 13, 6, 4, 5, 8, 12, 12, 6 ______
Answer:
9

Order the data from the least to the greatest.
4, 5, 5, 6, 6, 8, 9, 12, 12, 13
The range is the difference between the greatest and the least data values.
The range = 13 – 4 = 9

Texas Go Math Grade 7 Module 12 Test Answers Question 7.
97, 106, 99, 97, 115, 95, 108, 100 ___
Answer:
20

Order the data from the least to the greatest.
95, 97, 97, 99, 100, 106, 108, 115
The range if the difference between the greatest and the least data values.
The range = 115 – 95 = 20

Question 8.
27, 13, 35, 19, 71, 12, 66, 47, 39 ___
Answer:
59

Order the data from the least to greatest.
12, 13, 19, 27, 35, 29, 47, 66, 71
The range if the difference between the greatest and the least data values.
The range = 71 – 12 = 59

Find the mean of each set of data.

Question 9.
3, 5, 7, 3, 6, 4, 8, 6, 9, 5 ______
Answer:
5.6

mean = \(\frac{3+5+7+3+6+4+8+6+9+5}{10}\)
= \(\frac{56}{10}\)
= 5.6

Texas Go Math Grade 7 Solutions Module 12 Answers Question 10.
8.1, 9.4, 11.3, 6.7, 6.2, 7.5
Answer:
8.2

mean = \(\frac{8.1+9.4+11.3+6.7+6.2+7.5}{6}\)
= \(\frac{49.2}{6}\)
= 8.2

Texas Go Math Grade 7 Module 12 Reading Start-Up Answer Key

Visualize Vocabulary

Use the ✓ words to complete the right column of the chart.

Texas Go Math Grade 7 Module 12 Answer Key Random Samples and Populations 1

Understand Vocabulary

Complete each sentence, using the preview words.

Question 1.
An entire group of objects, individuals, or events is a ______
Answer:
A population

Texas Go Math Grade 7 Module 12 Answer Key Question 2.
A _____ is part of the population chosen to represent the entire group.
Answer:
A sample

Question 3.
A sample that does not accurately represent the population is a ___.
Answer:
A biased sample

Texas Go Math Grade 7 Module 12 Answer Key Random Samples and Populations Read More »

Texas Go Math Grade 7 Lesson 13.1 Answer Key Calculating Sales and Income Tax

Refer to our Texas Go Math Grade 7 Answer Key Pdf to score good marks in the exams. Test yourself by practicing the problems from Texas Go Math Grade 7 Lesson 13.1 Answer Key Calculating Sales and Income Tax.

Texas Go Math Grade 7 Lesson 13.2 Answer Key Calculating Sales and Income Tax

Example 1.
Rafiq purchases products from a nursery for his yard. The table shows his purchases and the prices. The sales tax rate is 7.5%. Find the total cost of his purchase, including tax.
Answer:
Find the tax on each item.
Black-Eyed Susan: ($6.25 . 2) . 7.5%
$12.50 . 0.075 = 0.9375 = 0.94

Step 2
Add the subtotal and the tax on each item to find its total price. Add to find the total cost of his purchase.
$12.50 + 0.94 = $13.44
Texas Go Math Grade 7 Lesson 13.1 Answer Key 1
The total cost of his purchase is $83.25.

Your Turn

7th Grade Sales Tax Math Problems Question 1.
What If? Suppose Rafiq returned to the nursery and bought a second tree priced at $49.99 and two packages of fertilizer priced at $12.99 each. Find the total cost of his purchase, including tax. ____
Answer:
Calculate tax for every product.
Second tree:($49.99. 1) . 7.5%
$49.99 . 0.075 = $3.74925 = $3.75
Package of fertilizer:($12.99 . 2) . 7.5%
$25.98 . 0.075 = $1.9485 = $1.94
Find a sum for the subtotal and the tax on each of them.
Total for the second tree:
$49.99 + $3.75 = $53.74
Total for packages of fertilizer:
$25.98 + $1.94 = $27.92
Texas Go Math Grade 7 Lesson 13.1 Answer Key 5
Total cost of his purchase is sum of total for every product and that is $164.91.

Tax for second tree is $3.75. Tax for packages of fertilizer is $1.94 Total, cost of his purchase is $164

Example 2.
Quinn’s gross monthly pay is $2,050. Federal withholding is 11.4% of her gross pay. Part of her monthly pay statement is shown in Step 2 below. Find Quinn’s net pay after all deductions.
Answer:
Step 1
Find the amount that is deducted for federal withholding.
Federal withholding = $2,050 × 0.114
= $233.70
Step 2
Find the total deductions
Gross Pay
Monthly Wages $2,050.00
Taxes
Federal Withholding $233.70
Social Security (6.2%) $127.10
Medicare (1.45%) $29.73
Total deductions = $233.70 + $127.10 + $29.73 = $390.53
net pay = gross pay – total deductions
= $2,050.00 – $390.53 = $1,659.47
Quinn’s net pay each month is $1,659.47.

Your Turn

How to Find the Sales Tax Rate in Go Math Question 2.
Arnetta’s monthly gross pay is $4,200. Federal withholding is 16.05% of her pay. Her other deductions total $321.30. Find her net pay.
Answer:
Fid the federal withholding of lier pay.
Write the percent as decimal, ie 16.05% = 0.1605.
Federal withholding $4. 200 × 0.1605 = $674.1
To find the total deductions, add federal withholding and her other deductions.
Total deductions = $674.1 + $321.30 = $995.4
Net pay is gross pay less total deductions.
Net pay = gross pay total deductions
= $4,200 – $995.4 = $3,204.6
Arnetta’s net pay each month is $3,204.6.

Example 3.
After deductions, Jonah has a taxable income of $26,318. He paid a total of $4,059 in federal withholding. Find the tax due on Jonah’s income. Then tell whether he will have to pay an additional amount or will get a refund.
Answer:
Step 1
Use a tax table to find the tax for a gross income of $26,318.
Texas Go Math Grade 7 Lesson 13.1 Answer Key 2
Step 2
Compare the tax due of $3,524 with the tax withheld of $4,059. $4,059 – $3,524 = $535
Jonah paid $535 more than he owed.

Question 3.
Glenda’s taxable income is $26,222. She paid $2,640 in federal withholding. Find the tax due on Glenda’s income. Then tell whether she will have to pay an additional amount or will get a refund. Use the tax table in Example 3.
Answer:
From the table, the tax for a gross income of $26,222 is $3, 509.
She paid $2,610 in federal withholding, which is less than the tax from the tax table.
Hence, she will have to pay the difference between the tax from the table and the amount she paid in the federal withholding, which is
$3,509 – $2,610 = $869
she will have to pay $869

Texas Go Math Grade 7 Lesson 13.1 Guided Practice Answer Key 

Find each amount. Use a sales tax rate of 8%. (Example 1)

Question 1.

sno Product description Unit price Number Subtotal Tax(8%) Total
1. Pens(3 pack) $3.59 3 $10.77

Answer:
Write the tax rate as decimal. ie 8% = 0.08
Tax = Subtotal × Tax
Tax = $10.77 × 0.08 = $0.86
Now, add the subtotal and the tax to find the total price.
Total = $10.77 + $0.86 = $11.63
Total is $11.63.
The tax is $0.86.
The total is $11.63

Taxation Answer Key 7th Grade Go Math Question 2.

s.no Product Description Unit price Number Subtotal Tax(8%) Total
2. Notebooks(2 pack) $1.99 2 $3.98

Answer:
Write the tax rate as decimal. ie 8% = 0.08
Tax = Subtotal × Tax
Tax = $3.98 × 0.08 = $0.32
Now, add the subtotal and the tax to find the total price.
Total = $3.98 + $0.32 = $4.3
Total is $4.3
The tax is $0.32.
The total is $4.3

Question 3.

sno Product description Unit price Number Subtotal Tax(8%) Total
3. Backpack $44.99 1 $44.99

Answer:
Write the tax rate as decimal. ie 8% = 0.08
Tax = Subtotal × Tax
Tax = $41.99 × 0.08 = $3.62
Now, add the subtotal and the tax to find the total price.
Total = $44.99 + $3.6 = $48.59
Total is $48.59
The tax is $3.62.
The total is $48.59.

Question 4.

sno Product description Unit price Number Subtotal Tax(8%) Total
4. Highlighters(4 pack) $5.15 1 $5.15

Answer:
Write the tax rate as decimal. ie 8% = 0.08
Tax = Subtotal × Tax
Tax = $5.15 × 0.08 = $0.41
Now, add the subtotal and the tax to find the total price.
Total = $5.15 + $0.41 = $5.56
Total is $5.56
The tax is $0.41.
The total is $5.56.

Lesson 13.1 Independent Practice Answer Key 7th Grade Go Math Question 5.
Texas Go Math Grade 7 Lesson 13.1 Answer Key 3
Answer:
To find the total cost, add all totals which we calculated in the previous questions.
Total cost = $11.63 + $4.3 + $48.59 + $5.56 = $70.08
The total cost is $70.08.

Question 6.
Juan earns a monthly salary of $3,200. Federal withholding is 14.1% of his gross pay. Juan has a total of $244.80 deducted for Social Security and Medicare. Find his net pay. (Example 2)
Answer:
First, find the federal withholding of his pay.
Write the percent as decimal, ie 14.1% = 0.141.
Federal withholding = $3,200 × 0.141 = $451.2
To find the total deductions, add federal withholding and deductions for Social Security and Medicare.
Total deductions = $451.2 + $244.80 = $696
Net pay is gross pay less total deductions.
Net pay = gross pay — total deductions
= $3, 200 – $696 = $2. 501
Juan’s net pay each month is $2, 504.

Question 7.
Lizaveta’s taxable income is $26,380. She paid $2,940 in federal withholding. Use a problem solving model to determine whether she will have to pay an additional amount or will get a refund. Use the tax table in Example 3. (Example 3)
Answer:
From the table, the tax for a gross income of $26,380 is $3,531.
She paid $2,940 in the federal withholding, which is less than the tax from the tax table.
Hence, she will have to pay the difference between the tax from the table and the amount she paid in the federal withholding. which is
$3,531 – $2,910 = $591
She will have to pay $591.

Essential Question Check-In

Question 8.
Suppose the sales tax rate in your area is 7.5%. Explain how to determine the total cost, including tax, of an eReader that costs $125.
Answer:
First, we have to find the tax of an eReader.
Write percent as decimal, ie 7.5% = 0.075.
Multiply the cost of eReader by the sales tax rate to find the find the tax.
$125 × 0.075 = $9.375
The tax of an eReader is $9.375.
To find the total cost. of eReader add the cost of eReader and the tax.
$125 + $9.375 = $134.375
The total cost of eReader is $134.375.

Texas Go Math Grade 7 Lesson 13.1 Independent Practice Answer Key  

Question 9.
Roland is purchasing pottery supplies for his pottery class. He buys a portable pottery wheel for $382.00, modeling clay for $12.00, and a pottery tool set for $16.14. If the tax rate is 8.25%, find the total tax he paid. Then find the total cost of his purchases.
Answer:
First, we have to find the tax of each item.
The tax rate is 8.25%.
Write the tax rate as decimal, ie 8.25% = 0.0825.
A portable pottery wheel priced at $38200
Tax = $382.00 × 0.0825 = $31.515
Now, add the total and the tax to find the total price.
Total = $382.00 + $31.515 = $413.515
Modeling clay priced at $12.00
Tax = $12.00 . 0.0825 = $0.99
Now, add the total and the tax to find the total price.
Total = $12.00 + $0.99 = $12.99
Pottery tool set priced at $16.14
Tax = $16.14 . 0.0825 = $1.33
Now, add the total and the tax to find the total price.
Total = $16.14 + $1.33 = $17.47
To find the total tax he paid, totalize all taxes.
Total Tax = $31.515 + $0.99 + $1.33 = $33.835
Finally, add all total prices to find the total cost of his purchase.
$413.515 + $12.99 + $17.47 = $443.975
The total cost of his purchase is $443.975.
The total tax he paid is $33.835.
The total cost of his purchase is $443.975.

Question 10.
Megna has $300 to buy a digital camera. She finds one she likes that costs $275.

a. Suppose the tax rate is 7.3%. Does Megna have enough to buy the camera? Explain.
Answer:
First. find the tax of a digital camera that costs 8275.
Vrite the tax rate as decimal. ie 7.3% = 0.073.
Tax = $275 × 0.073 = $20.075
Now, add the cost of a digital camera and the tax to find to total cost of a digital camera.
Total cost = $273 + $20.075 = $295.073
The total cost of a digital camera that Megna wants to buy is $295.075, hence she has enough money to buy it.

b. Megna discovers that the digital camera needs a memory card. She finds a memory card on sale for $9.99 plus tax. Can Megna afford the card?
Answer:
The total cost of a digital camera is $295.075 and Megna has $300.
After she buys a digital camera, she remains $4.925.
A memory card costs $9.99 plus tax, which is more from what she had left.
Hence, she can not afford the memory card.

Question 11.
Casey is looking at the used car shown. Suppose that Casey is able to get $1,200 in trade for his old vehicle. The sales tax rate is 7.75%. How much will Casey pay in taxes on the reduced sales price?
Answer:
Determine the price of the used car when Casey traded his old vehicle.
12,999 – 1,200 = 11,799
After the trade, the car cost $11,799. Determine the sales tax for the car.
Show the tax rate as a decimal.
11.799 × 0.0775 = 914.4225 ≈ 914.42
The sales tax for the car is $914.42.

Question 12.
What’s the Error? Lauren wants to buy 3 shirts at $15.00 each. At home, she calculates the totai cost as $46.20, using the sales tax rate of 8%. At the store, the cashier tells Lauren the total cost is $48.60. Who is wrong and what mistake did he or she make?
Answer:
Each shirt costs $15.00 and 3 shirts cost 3 × $15.00 = $45.
Write the tax rate as decimal. ie 8% = 0.08.
First, find the tax of 3 shuts.
Tax = $45 × 0.08 = $3.6
Now, add the cost of 3 shirts and the tax to find the total cost of shirts.
Total cost = $45 + $3.6 = $18.6
The total cost of 3 shirts is $48.6, hence Lauren made a mistake.
The mistake Lauren made is that she did not calculated the tax of all 3 shirts. but only of one shirt.
Let ‘s check.
The tax of one shirt is
The tax = $15 × 0.08 = $1.2
Now, add the cost of 3 shirts mid the tax of one shirt to find the total cost.
Total cost = $45 + $1.2 = $46.2
Lauren made a mistake.

7th Grade Go Math Lesson 13.1 Total Purchase Price Answer Key Question 13.
Camden earns $25 per hour and works 40 hours a week.

a. Camden gets paid every 2 weeks. Federal withholding is 15.6% of his gross pay, Social Security is 6.2% of his gross pay, and Medicare is 1.45%. Find Camden’s net pay after 2 weeks. Show your work.
Answer:
First, find Camden’s gross pay for 2 weeks.
He works 40 hours a week, hence he works 80 hours for 2 weeks.
He earns $25 per hour. hence lie earns 80 × $25 = $2, 000 for 2 weeks.
First, find the Federal withholding of his gross pay.
Write the percent as decimal, ie 15.6% = 0.156.
Federal withholding = $2,000 × 0.156 = $312
Second, find the Social Security of his gross pay.
Write the percent as decimal, ie 6.2% = 0.062.
Social Security = $2. 000 × 0.062 = $124

Third, find the Medicare of his gross pay.
Write the percent as decimal, ie 1.45% = 0.0145.
Social Security = $2,000 × 0.0145 = $29
To find the total deductions, add Federal withholding and Social Security and Medicare.
Total deductions = $312 + $124 + $29 = $465
Net pay is gross pay less total deductions.
Net pay = gross pay – total deductions
= $2,000 – $465 = $1,535
Camden’s net pay after 2 weeks is $1,535.

b. What If suppose Camden gets a raise of $5 per hour and pays 17.2% of his gross pay in federal withholding. What would his net pay for 2 weeks be? Make sure to factor in his social security and Medicare withholdings.
Answer:
Now, suppose Camden gets a raise of $5 per hour, hence he earns $30 per hour.
He works 80 hours for 2 weeks, so he earns 80 × $30 = $2,400 for 2 weeks.
Also, Federal withholding is now 17.2%.
Find the Federal withholding of his gross pay.
Write the percent as decimal, ie 17.2% = 0.172.
Federal withholding = $2, 400 × 0.172 = $412.8
The rate of Social Security and Medicare are the same as in Part a.
Find the Social Security of his gross pay.
Write the percent as decimal, ie 6.2% = 0.062.
Social Security = $2. 100 × 0.062 = $148.8
Find the Medicare of his gross pay.
Write the percent as decimal, ie 1.45% = 0.0145.
Medicare = $2. 400 × 0.0 145 = $34.8

To find the total deductions. add Federal withholding and Social Security and Medicare.
Total deductions = $412.8 + $148.8 + $34.8 = $596.4
Net pay is gross pay less total deductions.
Net pay = gross pay – total deductions
= $2,400 – $569.4
= $1,803.6
Camden’s net pay after 2 weeks will be $1, 803.6.

Question 14.
Critique Reasoning Samantha said adding 6% to the cost of an item for sales tax makes the total cost 106% of the original price. Joshua disagrees. Is Samantha’s reasoning accurate? Explain.
Answer:
Yes, it is.
When you calculate the sales tax of an item, you calculate it of the original, price of that item, and that original price represents the 100% of that item.
So, when you calculate 6% of the original price and add it to the original price, which is 100%, that sum is 100% + 6% = 106% of the original price.

Question 15.
After deductions, Elizabeth’s taxable income was $28,536. She had $344 withheld each month for taxes. Use the tax table shown to find how much she will get as a refund or owe.
Texas Go Math Grade 7 Lesson 13.1 Answer Key 4
Answer:
From the table, the tax for taxable income of $28,536 is $3,854.
She had $341 withheld each month for taxes, so for a year she had withheld
12 × $344 = $4,128
The amount she had withheld is greater than the amount of tax is. so she will get a refund.
The refund = $4. 128 – $3,854 = $274
She will get a refund of $274.

Texas Go Math Grade 7 Lesson 13.1 H.O.T. Focus on Higher Order Thinking Answer Key  

Question 16.
Persevere in Problem Solving A family buys groceries for $ 149.98, including $10.07 in taxes. The bill includes $26.95 worth of items that are not taxable. Find the sales tax rate. Round your answer to the nearest tenth of a percent.
Answer:
First, we have to subtract the worth of items that are not taxable from the whole bill, to find the bill of all groceries that are taxable.
$149.98 – $26.95 = $123.03
$123.03 is the bill of all groceries that are taxable.
Now, taxes apply only to this amount, $123.03.
We have to find how much $10.07 is actually a percentage of $123.03 and that would represent the sales tax rate.
How to find what percent of X is Y.
The percentage formula is
\(\frac{Y}{X}\) = P%
In our case, Y = 10.07 and X = 123.03.
\(\frac{10.07}{123.03}\) = 0.08
The result will always be in decimal form, not percentage form.
We need to multiply the result by 100 to get the percentage.
0.08 × 100 = 8
Hence, the sales tax rate is 8%.

Question 17.
Multistep Suppose the personal income tax rate is changed to a flat rate of 15% of one’s taxable income. Use the tax table in problem 15 to investigate the effect of the change in the rate on a single taxpayer with a taxable income of $28,443.
Answer:
From the table, the tax for taxable income of $28,113 is $3,839.
Let’s find how much $3,839 is actually a percentage of $28,413 and that would represent the tax rate from the table.
How to find what percent of X is Y.
The percentage formula is
\(\frac{Y}{X}\) = P%
In our case, Y = 3,839 and X = 28,443.
\(\frac{3,839}{28,443}\) = 0.13
The result will always be in decimal form, not percentage form.
We need to multiply the result by 100 to get the percentage.
0.13 × 100 = 13
The tax rate from the table is 13%. which is less than 15%.
Hence, this change would effect bad on a single taxpayer because lie would pay more if the tax rate is 15%.
This change would effect bad on a single taxpayer because he would pay more if the tax rate is 15%.

Question 18.
Represent Real-World Problems You have $3,000 to spend on a laptop. Suppose the tax rate is 6.78%. What is the maximum you can spend on a laptop if you know you will also be purchasing a $25 case? Explain.
Answer:
When you add the tax rate on the cost of some item, you get the total cost of that item.
Total cost = The cost + The tax
The cost of a item represents 100% of that item and when you add the tax rate(given in percent), the total cost in percent will be
Total cost% = 100% + Tax rate(%)
In this case, you have $3,000 to spend on a laptop and a case.
Hence, the total cost of a laptop and a case must not be greater than $3.000.
The tax rate is 6.78%. so the total cost of a laptop and a case in percent is
100% + 6.78% = 106.78%

$3,000 is actually 106.78%. and we want to know how much money is 100% which is, in our case, the cost of a laptop and a case.
We can set a proportion to calculate that.
$3,000 represents 106.78%, and we want to know how much money is 100%.
Let x be the amount of money that represents this 100%, ie the maximum amount of money we can spend on a laptop and a case.
The proportion:
Texas Go Math Grade 7 Lesson 13.1 Answer Key 6
The cost of a laptop and a case is $2, 809.51.
We know that the cost of a case is $25. so we have to subtract the cost of a case from $2, 809.51.
$2, 809.51 – $25 = $2,781.51
The maximum cost of a laptop is $2,784.51.

Texas Go Math Grade 7 Lesson 13.1 Answer Key Calculating Sales and Income Tax Read More »

Texas Go Math Grade 7 Lesson 12.2 Answer Key Making Inferences from a Random Samples

Refer to our Texas Go Math Grade 7 Answer Key Pdf to score good marks in the exams. Test yourself by practicing the problems from Texas Go Math Grade 7 Lesson 12.2 Answer Key Making Inferences from a Random Samples.

Texas Go Math Grade 7 Lesson 12.2 Answer Key Making Inferences from a Random Samples

Texas Go Math Grade 7 Lesson 12.2 Explore Activity 1 Answer Key  

Using Dot Plots to Make Inferences

After obtaining a random sample of a population, you can use statistical representations of the data from the sample, such as a dot plot or box plot, to make inferences about the population.

Rosee asked students on the lunch line how many books they had in their backpacks. She recorded the data as a list: 2, 6, 1, 0, 4, 1, 4, 2, 2. Make a dot plot for the books carried by this sample of students.

Step 1:
Order the data from least to greatest. Find the least and greatest values in the data set.
Step 2:
Draw a number line from 0 to 6. Place a dot above each number on the number line for each time it appears in the data set.
Texas Go Math Grade 7 Lesson 12.2 Answer Key 1

Reflect

Question 1.
How are the number of dots you plotted related to the number of data values?
Answer:
Texas Go Math Grade 7 Lesson 12.2 Answer Key 9
In the above dot plot, each dot represents a single student carrying that particular number of books. For example on the number line at 2, the number of dots is three, which means that there are 3 students who have two books in their backpacks. So simply we can say that the number of dots represents the number of students.

A number of dots represent the number of students.

Go Math Grade 4 Lesson 12.2 Answer Key Question 2.
Complete each qualitative inference about the population.
Most students have _____________ 1 book in their backpacks.
Most students have fewer than ___________ books in their backpacks.
Most students have between _____________ books in their backpacks.
Answer:
Most students have at least 1 book in their backpacks.
Most students have fewer than six books in their backpacks.
Most students have between two to six books in their backpacks.

Most students have at least 1 book in their backpacks.

Question 3.
What could Rosee do to improve the quality of her data?
Answer:
The number of sample of students taken by Rosee is only nine which is very small as compared to the number of students in school. And we know that the accuracy of any data is directly proportional to number of data collected or size of the sample. So if the size of sample is large then the probability of common result is more.
Hence, to improve the quality of her data Rosee should increase the number of sample of students.
Rosee should increase the size of sample.

Rosee should increase the size of sample to improve quality of data.

Texas Go Math Grade 7 Lesson 12.2 Explore Activity 2 Answer Key 

Using Box Plots to Make Inferences
You ‘can also analyze box plots to make inferences about a population.

The number of pets owned by a random sample of students at Park Middle School is shown below. Use the data to make a box plot.
9, 2, 0, 4, 6, 3, 3, 2, 5
Texas Go Math Grade 7 Lesson 12.2 Answer Key 2
step 1:
Order the data from least to greatest. Then find the least and greatest values, the median, and the lower and upper quartiles.
The lower and upper quartiles can be calculated by finding the medians of each “half” of the number line that includes all the data.
Texas Go Math Grade 7 Lesson 12.2 Answer Key 3
Step 2:
Draw a number line that includes all the data values.
Plot a point for each of the values found in Step 1.
Texas Go Math Grade 7 Lesson 12.2 Answer Key 4
Step 3:
Draw a box from the lower to upper quartile. Inside the box, draw a vertical line through the median. Finally, draw the whiskers by connecting the least and greatest values to the box.

Reflect

Making Inferences 7th Grade Lesson 12.2 Answer Key Question 4.
Complete each qualitative inference about the population.
A good measure for the most likely number of pets is _____
50% of the students have between ________ and 3 pets.
Almost every student in Parkview has at least _______________ pet.
Answer:
A good measure for the most likely number of pets is three because the median of the given data is 3
50% of the students have between 0 and 3 pets because out of all the given data, half of the data is between 0 to 1
Almost every student in Parkview has at least two pets because except 1 student everyone has at least 2 pets.

Almost every student in Parkview has at least 2 pets.

Using Proportions to Make Inferences

A random sample has a good chance of being representative of the population. You can use data about the sample and proportional reasoning to make inferences or predictions about the population.

Example 1.
A shipment to a warehouse consists of 3,500 MP3 players. The manager chooses a random sample of 50 MP3 players and finds that 3 are defective. How many MP3 players in the shipment are likely to be defective?
Answer:
It is reasonable to make a prediction about the population because this sample is random.
Step 1
Set up a proportion.
Texas Go Math Grade 7 Lesson 12.2 Answer Key 5
Step 2
Substitute values into the proportion.
Texas Go Math Grade 7 Lesson 12.2 Answer Key 6
Based on the sample, you can predict that 210 MP3 players in the shipment would be defective.

Your Turn

Question 5.
What If? How many MP3 players in the shipment would you predict to be damaged if 6 MP3s in the sample had been damaged?
Answer:
Total number of MP3 player in warehouse = 3, 500
Number of MP3 player taken in random sample = 50
Number of damage MP3 player in random sample = 6
Texas Go Math Grade 7 Lesson 12.2 Answer Key 10
z = 420
Hence, we can predict that 420 MP3 players would have been damaged.

we can predict that 420 MP3 players would have been damaged.

Reflect

Lesson 12.2 Making Statistical Inferences Answer Key Question 6.
How could you use estimation to check if your answer is reasonable?
Answer:
To check answer to the previous problem is reasonable or not we can use estimation. In the problem, it is given that there are a total of 3,500 MP3 players and the manager is choosing a sample of 50 MP3 players. This means that the number of samples will \(\frac{3,500}{50}\) = 70. It is also given that in each sample 6 MP3 players are defective, so out of 50, 6 MP3 players are defective. Hence 70 samples the number of defective MP3 players will be 6 × 70 = 420. So the answer found in the previous problem is reasonable.

Number of defective MP3 player: 6 × 70 = 420

Texas Go Math Grade 7 Lesson 12.2 Guided Practice Answer Key 

Patrons in the children’s section of a local branch library were randomly selected and asked for their ages. The librarian wants to use the data to infer the ages of all patrons of the children’s section so he can select age-appropriate activities. (Explore Activity 1 and 2)

7, 4, 7, 5, 4, 10, 11, 6, 7, 4

Question 1.
Make a dot plot of the sample population data.
Texas Go Math Grade 7 Lesson 12.2 Answer Key 7
Answer:
Texas Go Math Grade 7 Lesson 12.2 Answer Key 11
Number of children is represented by dots.

Question 2.
Make a box plot of the sample population data.
Texas Go Math Grade 7 Lesson 12.2 Answer Key 8
Answer:
Texas Go Math Grade 7 Lesson 12.2 Answer Key 12
Box plot of sample population data is shown in different colour.

Question 3.
The most common age of children that use the library is ______ and _____.
Answer:
The most common age of the children that uses the library is four and seven. Because there are three students of age four and three students of age seven in local library out given sample which is ten number of students.

Question 4.
The range of ages of children that use the library is from _______ to ____.
Answer:
The range of ages of children that use the library is from four to eleven. Because out the given sample (age of the students who are in the local library) students with the least age is 4 and the student with a maximum age of 11.

Lesson 12.2 Making Inferences From A Random Sample Answer Key Question 5.
The median age of children who use the library is ____.
Answer:
Arranging the given data: 4, 4, 4, 5, 6, 7, 7, 7, 10, 11
So, here we can see that total number of sample is 10 which an even number. And the total number of sample is even then the median of sample is the average of two middle number.
Median of given sample will be the mean of 5th and 6th term.
Median = \(\frac{6+7}{2}\)
= \(\frac{13}{2}\)
= 6.5
The median age of children that use the library is 6.5

Question 6.
A manufacturer fills an order for 4,200 smart phones. The quality inspector selects a random sample of 60 phones and finds that 4 are defective. How many smart phones in the order are likely to be defective? (Example 1)
About ____ smart phones in the order are likely to be defective.
Answer:
Total number of smart phone ordered = 4,200
Number of smart phone random sample = 60
Number of defective smart phone in random sample = 4
defective smart phone in sample defective smart phone in population
Texas Go Math Grade 7 Lesson 12.2 Answer Key 13
Hence, we can predict that 280 smart phone would have been defective.
About 280 smart phones in the order are likely to be defective.

Question 7.
Part of the population of 4,500 elk at a wildlife preserve is infected with a parasite. A random sample of 50 elk shows that 8 of them are infected.
How many elk are likely to be infected? (Example 1)
Answer:
Number of people at a wildlife = 4,500
Number of people in random sample = 50
Number of infected people in random sample = 8
Texas Go Math Grade 7 Lesson 12.2 Answer Key 14
Hence, we can predict that 720 people would have been infected.

Essential Question Check-In

Question 8.
How can you use a random sample of a population to make predictions?
Answer:
A sample in which every person object or event has an equal chance off being selected is called as random sample. So random sample of population can used to make the predictions. For example there are 600 students in school. We went in canteen and asked the random sample of 60 students that how many books do they have in
their backpack. And the 15 students replied that they have 4 books. By using the proportional relation we can predict that out of 600 students in school \(\frac{15}{60}\) = \(\frac{x}{600}\) the number students with 4 books are x = 150. Hence in this way a random sample of a population is used to make predictions.

By proportion relation we can use random sample of population to make predictions.

Texas Go Math Grade 7 Lesson 12.2 Independent Practice Answer Key 

Question 9.
A manager samples the receipts of every fifth person who goes through the line. Out of 50 people, 4 had a mispriced item. If 600 people go to this store each day, how many people would you expect to have a mispriced item?
Answer:
Total number of people going to store = 600
Number of people in random sample = 50
Number of people who have misplaced item = 4
Texas Go Math Grade 7 Lesson 12.2 Answer Key 15
Hence, we can predict that 48 people have mispriced items.

Question 10.
Jerry randomly selects 20 boxes of crayons from the shelf and finds 2 boxes with at least one broken crayon. If the shelf holds 130 boxes, how many would you expect to have at least one broken crayon?
Answer:
Total number of crayons boxes on shelf = 130
Number of crayons boxes in random sample = 20
Number of boxes with broken crayons = 2
Texas Go Math Grade 7 Lesson 12.2 Answer Key 16
Hence, we can expect out of 130 crayons boxes 13 boxes are with broken crayons.

Question 11.
A random sample of dogs at different animal shelters in a city shows that 12 of the 60 dogs are puppies. The city’s animal shelters collectively house 1,200 dogs each year. About how many dogs in all of the city’s animal shelters are puppies?
Answer:
Total number of dogs in city’s animal shelter = 1, 200
Number of dogs which are puppies = 12
Number of dogs taken in sample = 60
Texas Go Math Grade 7 Lesson 12.2 Answer Key 17
Hence, we can predict that out of 1,200 dogs, 240 dogs may be puppies.

Lesson 12.2 Independent Practice Answer Key 6th Grade Question 12.
Part of the population of 10,800 hawks at a national park is building a nest. A random sample of 72 hawks shows that 12 of them are building a nest. Estimate the number of hawks building a nest in the population.
Answer:
Total number of hawks at the national park = 10, 800
Number of hawks who are building nests = 12
Number of hawks taken in sample = 72
Texas Go Math Grade 7 Lesson 12.2 Answer Key 18
Hence, we can predict that out of 10,800 hawks, 1800 hawks building nests.

Question 13.
In a wildlife preserve a random sample of the population of 150 raccoons was caught and weighed. The results, given in pounds, were 17,19,20,21, 23,27,28, 28, 28 and 32. Jean made the qualitative statement, “The average weight of the raccoon population is 25 pounds.” Is her statement reasonable? Explain.
Answer:
In the given problem, the weight of att the 150 raccoons is not given so we cannot find the average weight of 150 raccoons. But in problem, is the average weight of 150 raccoons is given 25 pounds. So the best way to find the average weight will be by finding the median of the given 10 weights.
Arranging weight in increasing order: 17, 19, 20, 21, 23, 27, 28, 28, 28, & 32.
(Here we can see that total number of sample (arranged in increasing order) is 10 which an even number And we know that when number of terms is an even number then the median is average of the two middle term. So here median will be the average of 5th and 6th term.)
Median = \(\frac{23+27}{2}\)
= \(\frac{50}{2}\)
= 25
Hence, the median is 25 so, Jean’s statement is reasonable.

Question 14.
Greta collects the number of miles run each week from a random sample of female marathon runners. Her data is shown below. She made the qualitative statement, “25% of female marathoners run 13 or more miles a week.” Is her statement reasonable? Explain. Data: 13, 14, 18, 13, 12, 17, 15, 12, 13, 19, 11, 14, 14, 18, 22, 12
Answer:
Arranging miles in increasing order: 11, 12, 12, 12, 13, 13, 13, 14, 14, 14, 15, 17, 18, 18, 19, 22
Total number of random sample = 16
Number of sample which are 13 or more miles = 12
Texas Go Math Grade 7 Lesson 12.2 Answer Key 19
Hence, 75% of female marathoner runs 13 or more miles.
So, Greta’s statement is not reasonable as she said 25% of female marathoner runs 13 or more miles.

Question 15.
A random sample of 20 of the 200 students at Garland Elementary is asked how many siblings each has. The data was ordered as shown. Make a dot plot of the data. Then make a qualitative statement about the population. Data: 0, 1, 1, 1, 1, 1, 1, 2, 2, 2, 2, 2, 3, 3, 3, 3, 4, 4, 4, 6
Answer:
Texas Go Math Grade 7 Lesson 12.2 Answer Key 20
Every dot represent the number of students with that particular number of siblings. For example at “1” number of dot is 6, this means that there 6 students who have 1 sibling.
In above dot plot we can see that maximum dot are between 1 and 4. So maximum number of students have siblings between 1 to 4. And there is only one student who have no siblings and also one students have 6 siblings.
Maximum students have siblings between 1 and 4.

Question 16.
Linda collects a random sample of 12 of the 98 Wilderness Club members’ ages. She makes an inference that most wilderness dub members are between 20 and 40 years old. Describe what a box plot that would confirm Linda’s inference should look like.
Answer:
It is given in problem that the age of most of the club member are between 20 to 40 years. This means that the maximum portion of the boxplot of this data will be between 20 to 40. So the box of box plot data representation will entirety lie between the 20 and 40.

Box of boxplot will lie between 20 t0 40.

Question 17.
What’s the Error? Kudrey was making a box plot. He first plotted the least and greatest data values. He then divided the distance into half, and then did this again for each half. What did Kudrey do wrong and what did his box plot look like?
Answer:
Kudrey thought that the box will show equal quartiles by dividing the distance between the least and greatest data values into four. A box plot has five statistical summary of the data set which are the median, least and greatest values, and the lower and upper quartiles. It s easy to plot the least and greatest values. Kudrey should determine the median from the data set and plot it as well. The median divides the data into two halves After which, determine the quartiles by determining the median of the two halves, which will be the lower and upper quartiles, respectively

Kudrey thought that the box will show equal quartiles by dividing the distance between the least and greatest data values into four.

Texas Go Math Grade 7 Lesson 12.2 H.O.T. Focus on Higher Order Thinking Answer Key 

Question 18.
Communicating Mathematical Ideas A dot plot includes all of the actual data values. Does a box plot include any of the actual data values?
Answer:
The median in the dot plot can be determined once calculated. The box plot can show some of the actual data values. These are the least and greatest data values and the median.

Least and greatest data values and the median

Question 19.
Make a Conjecture Sammy counted the peanuts in several packages of roasted peanuts. He found that the bags had 102, 114, 97, 85, 106, 120, 107, and 111 peanuts. Should he make a box plot or dot plot to represent the data? Explain your reasoning.
Answer:
Since the data set does not have any duplicates, a box plot is more applicable to represent the data. This is because the data values can be easily represented through a box plot. The box plot would show the five key values to represent a set of data. These are the least and greatest data values, the lower and upper quartiles, and the median. The interquartile range can also be determined through the use of the box plot

Question 20.
Represent Real-World Problems The salaries for the eight employees at a small company are $20,000, $20,000, $22,000, $24,000, $24,000, $29,000, $34,000 and $79,000. Make a qualitative inference about a typical salary at this company. Would an advertisement that stated that the average salary earned at the company is $31,500 be misleading? Explain.
Answer:
Evaluate the average salary front the given data, therefore:
Texas Go Math Grade 7 Lesson 12.2 Answer Key 21
Evaluate:
Average salary = 31,500
It can be seen that the average salary is evaluated to he $31,500 but the given data does not reveal so. This is because there is one outlier in this data set which is $79,000. if the average salary is evaluated by flot considering
this value, it will be:
Texas Go Math Grade 7 Lesson 12.2 Answer Key 22
Evaluate:
Average salary = 24,714
This is a more accurate measure of the average salary. Therefore yes the advertisement stating that the average salary is $31,500 is misleading.

Yes, the advertisement stating that the average salary is $31,500 is misleading because there is an outlier in the given data set, without which the average salary come out to be $24,714.

Texas Go Math Grade 7 Lesson 12.2 Answer Key Making Inferences from a Random Samples Read More »

Texas Go Math Grade 7 Module 13 Quiz Answer Key

Refer to our Texas Go Math Grade 7 Answer Key Pdf to score good marks in the exams. Test yourself by practicing the problems from Texas Go Math Grade 7 Module 13 Quiz Answer Key.

Texas Go Math Grade 7 Module 13 Quiz Answer Key

Texas Go Math Grade 7 Module 13 Ready to Go On? Answer Key

13.1 Calculating Sales and income Tax

Question 1.
Marcel bought a new hat for $21.99 and 2 pairs of socks for $3.99 each. What is the total price, including a 7.5% sales tax? _____________
Answer:
First, sum the price for a hat and 2 pairs of socks to find the Subtotal of the purchase.
Subtotal = Price of a hat + Price of 2 pairs of socks
Subtotal = $21.99 + 2 × $3.99
Subtotal = $21.99 + $7.98
Subtotal = $29.97
The Subtotal of the purchase is $29.97.

Now, we have to find the sales tax.
Write the tax rate as decimal, ie 7.5% = 0.075
Tax = Subtotal × Tax
Tax = $29.97 × 0.075 = $2.25
Now, add the Subtotal and the Tax to find the Total price.
Total price = $29.97 + $2.25 = $32.22
The Total price of the purchase is $32.22

For 2-3, use the tax table shown. Jennifer computed her taxable income as $24,382 and paid $3,115 in federal 24,250 withholding.

Texas Go Math Grade 7 Module 13 Quiz Answer Key 1

Paying Your Taxes Math Quiz 7th Grade Question 2.
How much federal income tax is Jennifer required to pay?
Answer:
From the table, the tax for a taxable income of $24,382 is $3,231 which she is required to pay.

Question 3.
Determine whether Jennifer still owes money or will get a refund, and what amount that is. _______________________________________
Answer:
From the table, the tax for a taxable income of $24, 382 is $3,231.
She paid $3,115 in the federal withholding, which is less than the tax from the tax table.
Hence, she will have to pay the difference between the tax from the table and the amount she paid in the federal withholding. which is $3,231 – $3,115 = $116

She will have to pay $116

13.2 Calculating and Comparing Simple and Compound Interest

Question 4.
Two savings accounts each start with a $200 principal and have an interest rate of 5%. One account earns simple interest and the other is compounded annually. Which account will earn more interest over 10 years? How much more?
Answer:
Let A be the account that earns simple interest, and B be the account that earns interest compounded annually.
The principal for both accounts is $200.

Account A
Write interest rate as decimal, ie 5% = 0.05
Find the amount of interest earned in otie year.
Principal × Interest rate = Interest in one year
$200 × 0.05 = $10
Now, find the amount of interest earned in ten years.
Interest for 1 year × Number of years = Interest for 10 years
$10 × 10 = $100
Account A will earn $100 after 10 years.

Account B
Use the formula for compound interest compounded annually.
A = P(1 + r)t
where P is the principal, r is interest rate(in decimal), t is the time in years and A is the amount in the account after t years if n withdrawals are made.
Find the final amount in the account after 10 years.
Substitute 10 for t, 200 for P and 0.05 for r in the formula.
A = 200(1 + 0.05)10
A = 200(1.05)10
A = 200.1.63
A = 326
The final amount in account B is $326.
To find the amount of interest earned subtract principal from the final amount.
$326 – $200 = $126
Account B will earn $126 after 10 years.

Compare the amounts using subtraction:
$126 – $100 = $26
Account B will earn $26 more in compound interest after 10 years than account A earns in simple interest.

Account B will earn $26 more in compound interest after 10 years than account A earns in simple interest.

13.3 Making Purchasing Decisions

Module 13 Math Quiz For Grade 7 Pdf Question 5.
Brenda wants to buy a sweater that is regularly priced at $27. She can apply one of two coupons, $5 off or 25% off. Which should she use? ____
Answer:
$5 off coupon
$5 off coupon is a Discount.
Find the Discount price.
Discount price = Regular price – Discount
Discount price = $27 – $5
Discount price = $22
The Discount price of a sweater with a $5 off coupon is $22.

25 % off coupon
Discount price = Regular price – Discount
To find the Discount multiply the Regular price by the percent of discount
Write percent as decimal, ie 25% = 0.25.
Discount = $27 × 0.25 = $6.75
Discount price = $27 – $6.75
Discount price = $20.25
She should use 25% off coupon, because $20.25 < $22.

Essential Question

Question 6.
How can you use your knowledge of taxes and simple and compound interest to help you make informed decisions in the real-world?
Answer:
Basically, being knowledgeable in taxes and compound interest lets you come up with a better decision when options are given. When you are knowledgeable in taxes, you would know the exact amount you are paying for a
certain item when you purchase. Though sometimes, it is hard to compute the taxes manually, you can make
estimations. As for compound interest it is very useful to make decisions as to where to invest when you have multiple options.

Being knowledgeable in taxes and compound interest lets you come up with a better decision when options are
given.

Texas Go Math Grade 7 Module 13 Mixed Review Texas Test Prep Answer Key 

Selected Response

Question 1.
Tela bought a backpack for $34.99 and 3 notebooks for $ 1.89 each. What is the total price, including a 8% sales tax?
(A) $38.77
(B) $40.66
(C) $41.87
(D) $43.91
Answer:
(D) $43.91
First, sum the price for a backpack and 3 notebooks to find the Subtotal of the purchase.
Subtotal = Price of a backpack + Price of 3 notebooks
Subtotal = $34.99 + 3 × $1.89
Subtotal = $34.99 + $5.67
Subtotal = $40.66
The Subtotal of the purchase is $40.66.

Now, we have to find the sales tax.
Write the tax rate as decimal, ie 8% = 0.08
Tax = Subtotal × Tax
Tax = $40.66 × 0.08 = $3.25
Now, add the Subtotal and the Tax to find the Total price.
Total price = $10.66 + $3.25 = $43.91
The Total price of the purchase is $43.91

Taylor’s gross monthly pay is $2,500. Use this information for 2-4.

Module 13 Quiz Ready To Go On Answer Key Question 2.
Taylor pays 15.6% of his monthly income for federal withholding. How much federal withholding does he pay?
(A) $32.50
(B) $375
(C) $390
(D) $2,110
Answer:
(C) $390

Multiply monthly gross by Federal withholding rate.
Write the percent as decimal, 15.6% = 0.156.
Federal withholding = $2,500 × 0.156 = $390

Question 3.
How much does Taylor pay for Medicare, which is 1.45% of his monthly salary?
(A) $30.56
(B) $36.25
(C) $2,140.56
(D) $2,536.25
Answer:
(B) $36.25

Write the percent as decimal, 1.45% = 0.0145.
Multiply monthly gross by Medicare rate.
Medicare = $2,500 × 0.0145 = $36.25

Question 4.
How much does Taylor pay for Social Security, which is 6.2% of his monthly salary?
(A) $130.82
(B) $155
(C) $2,240.82
(D) $2,655
Answer:
(B) $155
Write the percent as decimal, 6.2% = 0.062.
Multiply monthly gross by Social Security rate
Social Security = $2,500 × 0.062 = $155

Question 5.
Kit can purchase a 6-pound item from several different retailers. Which is the best buy?
(A) Buy online for $24 plus pay shipping and handling costs of $0.79 per pound
(B) Buy online for $25 plus pay shipping and handling costs of $0.49 per pound
(C) Pay at a local store with a regular price of $32.95 and a $5-off coupon.
(D) Pay at a local store with a regular price of $40 on sale for 25% off.
Answer:
(B) Buy online for $25 plus pay shipping and handling costs of $0.49 per pound

Online purchase A
The item lias 6 pounds and shipping and handling per pound is $0.79. Shipping and handling for item is
$0.79 × 6 = $4.74
To find the whole price of item sum the online price and the cost of shipping and handling.
$24 + $4.74 = $28.74
Online purchase A costs $28.74.

Online purchase B
The item lias 6 pounds and shipping and handling per pound is $0.19.
Shipping and handling for item is
$0.49 × 6 = $2.94
To find the whole price of item sum the online price and the cost of shipping and handling.
$25 + $2.94 = $27.94
Online purchase A costs $27.94.

Locally purchase C
$5 off coupon is a Discount.
Find the Discount price.
Discount price = Regular price – Discount.
Discount price = $32.95 – $5
Discount price = $27.95
The Discount price for locally purchase C is $27.95.

Locally purchase D
25% off coupon is a Discount.
Find the Discount price.
To find the Discount multiply the Regular price by the percent of discount.
Write percent as decimal, ie 25% = 0.25.
Discount = $40 × 0.25 = $10
Discount price Regular price – Discount
Discount price = $10 — $10
Discount price = $30
The Discount price for locally purchase D is $27.95.

Hence, the best buy is online purchase B, because $27.94 is the lowest price of all prices.
The best buy is online purchase B

Math Quiz For Grade 7 With Answers Pdf Module 13 Question 6.
Each year on the same day, Lia deposits $225 in an account that earns simple interest at a rate of 4%. How much interest does her account earn after 10 years?
(A) $9
(B) $90
(C) $234
(D) $495
Answer:
(B) $90

Texas Go Math Grade 7 Module 13 Quiz Answer Key 4

New balance = Beginning balance for new phase + Amount deposited
Amount of interest earned = New balance × Interest rate
Write the interest rate as decimal, ie 4% = 0.04.
Every year we calcuLate simple interest on a new balance to find the amount of a interest earned.

Year 1
Amount of interest earned = $225 × 0.04 = $9
Year 2
Amount of interest earned = $450 × 0.04 = $18
Year 3
Amount of interest earned = $675 × 0.04 = $27
Year 4
Amount of interest earned = $900 × 0.04 = $36
Year 5
Amount of interest earned = $1,125 × 0.04 = $45
Step 4
Year 6
Amount of interest earned = $1,350 × 0.04 = $54
Year 7
Amount of interest earned = $1,575 × 0.04 = $63
Year 8
Amount of interest earned = $1,800 × 0.04 = $72
Year 9
Amount of interest earned = $2.025 × 0.04 = $81
Year 10
Amount of interest earned = $2,250 × 0.04 = $90
Lia earns a total of $495 in interest after the tenth year.

Question 7.
Omar deposits $300 in an account earning 3% interest compounded annually. How much interest will the account earn after 5 years if he makes no withdrawals?
(A) $45
(B) $47.78
(C) $345
(D) $347.78
Answer:
Use the formula for Compound interest compounded annually.
A = P(1 + r)t
where P is the principal, r is interest rate(hi decimal), t is the time in years and A is the amount in the account alter t years if no withdrawals are made.
Find the final amount in the account after 5 years.
Substitute 5 for t, 300 for P and 0.03 for r in the formula.
A = 300(1 + 0.03)5
A = 300(1.03)5
A = 300 . 1.159
A = 347.78
The final amount in account, B is $347.78.
To find the amount of interest earned subtract the principal from the final amount.
$347.78 – $300 = $47.78
Account will earn $47.78 in interest after 5 years.

Gridded Response

Grade 7 Module 13 Answer Key Quiz Question 8.
Carey computed her taxable income as $27,342 and paid $4,127 in federal withholding. Use the tax table to find the amount in dollars Ca’rey will get as a refund.
Texas Go Math Grade 7 Module 13 Quiz Answer Key 2
Answer:
From the table, the tax for a taxable income of $27.342 is $3,674.
Carey paid $4,127 in the federal withholding. which is more than the tax from the tax table.
Hence, the difference between the amount she paid in the federal withholding and the tax from the table is a refund, which is
$4, 127 – $3,674 = $453

A refund is $453.

Texas Go Math Grade 7 Module 13 Quiz Answer Key Read More »

Texas Go Math Grade 7 Module 11 Quiz Answer Key

Refer to our Texas Go Math Grade 7 Answer Key Pdf to score good marks in the exams. Test yourself by practicing the problems from Texas Go Math Grade 7 Module 11 Quiz Answer Key.

Texas Go Math Grade 7 Module 11 Quiz Answer Key

11.1 Analyzing Categorical Data

Texas Go Math Grade 7 Module 11 Ready to Go On? Answer Key

The circle graph shows the results of 25 student votes for the new class pet. Find the number of votes for each animal.

Texas Go Math Grade 7 Module 11 Quiz Answer Key 2

Question 1.
bird _______
Answer:
Total number of students who voted = 25
Percentage of vote for the bird as pet = 56%
percentage of vote for bird
Texas Go Math Grade 7 Module 11 Quiz Answer Key 8
= 0.56 × 25
= 14
Hence, the number of votes for the bird is 14

Texas Go Math Grade 7 Module 11 Answer Key Question 2.
hamster ______
Answer:
Total number of students who voted = 25
Percentage of votes for the hamster as a pet = 12%
Texas Go Math Grade 7 Module 11 Quiz Answer Key 9
= 0.12 × 25
= 3
Hence, number of votes for hamster is 3

Question 3.
ferret _______
Answer:
Total number of students who voted = 25
Percentage of vote for the ferret as pet = 8%
Texas Go Math Grade 7 Module 11 Quiz Answer Key 10
= 0.08 × 25
= 2
Hence, number of votes for ferret is 2

Question 4.
snake ______
Answer:
Total number of students who voted = 25
Percentage of vote for the snake as pet = 24%
Texas Go Math Grade 7 Module 11 Quiz Answer Key 11
= 0.24 × 25
= 6
Hence, number of votes for snake is 6

11.2 Comparing Data Displayed in Dot Plots

Texas Go Math Grade 7 Module 11 Quiz Answer Key 1

The two dot plots show the number of miles run by 14 students at the beginning and at the end of the school year. Compare each measure of the two dot plots.

Grade 7 Math Module 11 Answer Key Question 5.
means ______
Answer:
Arranging the data of mites run by all the 14 students:
Miles run at start of school year : 5, 6, 6, 7, 7, 7, 7, 8, 8, 8, 8, 9, 9, 10
Miles run at end of school year : 6, 6, 7, 7, 8, 8, 8, 8, 9, 9, 9, 10, 10, 10
Texas Go Math Grade 7 Module 11 Quiz Answer Key 12

Question 6.
medians __________
Answer:
Arranging the data of miles run by all the 14 students:
Mites run at start of school year: 5, 6, 6, 7, 7, 7, 7, 8, 8, 8, 8, 9, 9, 10
Miles run at end of school year: 6, 6, 7, 7, 8, 8, 8, 8, 9, 9, 9, 10, 10, 10
Here, total number of terms are 14 which is an even number so the medians of the data will be the average of 7th and 8th term
Texas Go Math Grade 7 Module 11 Quiz Answer Key 13

7th Grade Quiz Module 11 Test Answers Question 7.
Ranges ________
Answer:
Arranging the data of miles run by att the 14 students:
Mites run at start of school year: 5, 6, 6, 7, 7, 7, 7, 8, 8, 8, 8, 9, 9, 10
Miles run at end of school year: 6, 6, 7, 7, 8, 8, 8, 8, 9, 9, 9, 10, 10, 10
Here, the range of mites run by the students will be the difference of maximum and minimum miles run by the students.
Range of start of school year = Max value – Min value
= 10 – 5
= 5
Range of start of school year = Max value – Min value
= 10 – 6
= 4

11.3 Comparing Data Displayed in Box Plots

Use the box plots of inches flown by two different model airplanes for the following exercises.

Texas Go Math Grade 7 Module 11 Quiz Answer Key 3

Question 8.
Which has a greater median flight length? _____________
Answer:
On observating the given box plot the length of air plane are:
Airplane A: 200, 208, 210, 225, & 234.
Airplane B: 180, 195, 204, 230, & 235.
Here total number of term is 5 which is an odd number, we know that when total number of terms is an odd then the median of the given data is middle term. So the median of length of airplane will be the 3rd term
Median of airplane A = 3rd term = 210
Median of airplane B = 3rd term = 204
Hence, the median length of airplane A is greater as compared to the length of airplane B.

Texas Go Math Grade 7 Answer Key Pdf Module 11 Test Question 9.
Which has a greater interquartile range? ______
Answer:
On observing the given box plot the lengths of the plane are:
Airplane A: 200, 208, 210, 225, & 234.
Airplane B: 180, 195, 204, 230, & 235.
Here the box shows the interquartile range. The interquartile angle is the difference between the upper and Lower quartile, which is represented by the length of the box.
Interquartile range of airplane A = Q3 – Q1 = 225 – 208 = 17
Interquartile range of airplane B = Q3 – Q1 = 230 – 195 = 35
Hence, interquartile range of airplane B is greater then airplane A

Question 1o.
Which appears to have a more predictable flight length? ______
Answer:
The more predictable flight length is by airplane A because the spread of airplane A is less as compared to the
airplane B Also the interquartile angle of airplane A is less as compared to the airplane B So when the length of
flight is compared airplane A is more predictable then airplane B

Essential Question

Question 11.
How can you use and compare data to solve real-world problems?
Answer:
In the real world, there are so many choices for you to decide which is better or not. Using and comparing data of
the choices helps to make a better decision. You can compare the data statistically to determine which is better.
This is a great help in decision making. For example, when you want to buy a car, you would gather information
about different cars and will compare their data to help you decide which should you purchase. Comparing data
will save you from making a wrong decision.

Using and comparing data helps to make a better decision.

Texas Go Math Grade 7 Module 11 Mixed Review Texas Test Prep Answer Key 

Selected Response
Chelsea is reading a 250-page book that is divided into five chapters. For 1-3, use the bar graph below.

Texas Go Math Grade 7 Module 11 Quiz Answer Key 4

Go Math Quiz For Grade 7 Module 11 Question 1.
What percent of the book’s pages are in Chapter 4?
(A) 24%
(B) 28%
(C) 35%
(D) 70%
Answer:
(B) 28%

Explanation:
Total number of pages given in book = 250
Number of pages in chapter 4 of book = 70
Texas Go Math Grade 7 Module 11 Quiz Answer Key 14
Hence, Option B (28%) is correct option

Question 2.
What percent of the book’s pages are in Chapters 3 and 4?
(A) 24%
(B) 28%
(C) 52%
(D) 65%
Answer:
(C) 52%

Explanation:
Total number of pages given in book = 250
Number of pages in chapter 3 of book = 60
Number of pages in chapter 4 of book = 70
Texas Go Math Grade 7 Module 11 Quiz Answer Key 15
Hence, Option C (52%) is the correct option

Texas Go Math Grade 7 Answer Key Quiz Question 3.
If Chelsea has read through the first half of Chapter 3, what percent of the book has she read?
(A) 25%
(B) 40%
(C) 44%
(D) 52%
Answer:
(B) 40%

Explanation:
Total number of pages given in book = 250
Number of pages in chapter 1 of book = 40
Number of pages in chapter 2 of book = 30
Number of pages in chapter 3 of book = 60
Total number of pages till 1st half of chapter 3 = 100
Texas Go Math Grade 7 Module 11 Quiz Answer Key 16
Hence, Option B (40%) is the correct option

Question 4.
What is -3\(\frac{1}{2}\) written as a decimal?
(A) -3.05
(B) -3.5
(C) -0.35
(D) -0.035
Answer:
(B) -3.5

Explanation:
Texas Go Math Grade 7 Module 11 Quiz Answer Key 17
Hence, option B(-3.5) is correct option

Go Math Module 11 Quiz Grade 7 Answer Key Question 5.
Which is a true statement based on the dot plots below?
Texas Go Math Grade 7 Module 11 Quiz Answer Key 5
(A) Set A has the lesser range.
(B) Set B has the greater median.
(C) Set A has the greater mean.
(D) Set B is less symmetric than Set A
Answer:
(B) Set B has the greater median.

Explanation:
On comparing both set A and set B we have conclusion:
Option A: is wrong because the range of set A is 10-60 and set B is 20-60
Option B: is correct because the median of set B is greater than set A
Option C: is wrong because the mean of set A is greater than set B
Option D: is wrong because set B is more symmetric at 40
Hence, option B is the correct option

Gridded Response

Question 6.
The dot plot shows the number of pencils each boy has at his desk in class.
Texas Go Math Grade 7 Module 11 Quiz Answer Key 6
Find the median for the number of pencils.
Texas Go Math Grade 7 Module 11 Quiz Answer Key 7
Answer:
From the given dot plot we can see that 3 boys has 1 pencils on desk, 4 boy has 2 pencils on desk, 2 boy has 3
pencils on desk and at last boy has 5 pencils on his desk. So arranging the given data in order.
1, 1, 1, 2, 2, 2, 2, 3, 3, 5
Total numbers of term are 10, so median will be average of 5th and 6th term.
Texas Go Math Grade 7 Module 11 Quiz Answer Key 18
Hence, median for number of pencils is 2
Table will be made as per below instruction:
1st column: mark + sign
2nd column : mark 0
3rd column : mark 0
4th column : mark 0
5th column : mark 2
6th column : mark 0
7th column : mark 0

Texas Go Math Grade 7 Module 11 Quiz Answer Key Read More »

Texas Go Math Grade 7 Lesson 12.3 Answer Key Comparing Populations

Refer to our Texas Go Math Grade 7 Answer Key Pdf to score good marks in the exams. Test yourself by practicing the problems from Texas Go Math Grade 7 Lesson 12.3 Answer Key Comparing Populations.

Texas Go Math Grade 7 Lesson 12.3 Answer Key Comparing Populations

Texas Go Math Grade 7 Lesson 12.3 Explore Activity 1 Answer Key  

Using Dot Plots to Compare Populations

You can compare two populations by taking a random sample of each population and comparing the samples using dot plots.

A test prep company gives its students a Pretest before the course and a Posttest after the course is completed. The test prep company picks a random sample of 10 students from each testing session.
Texas Go Math Grade 7 Lesson 12.3 Answer Key 1

A. Make a dot plot for the sample of Pretest scores.
Texas Go Math Grade 7 Lesson 12.3 Answer Key 2

B. Make a dot plot for the sample of Posttest sores.
Texas Go Math Grade 7 Lesson 12.3 Answer Key 3

C. Compare the dot plots. The plots have a similar center/spread but the Posttest values are shifted to the _____.

Reflect

Go Math Grade 7 Answer Key Pdf Comparing Populations Question 1.
What can you infer about the populations by comparing the dot plots for the samples?
Answer:
Comparing the dot plots of both sample we get information :

  • median of pretest score is 515 and the median of the posttest is 575. So the post-test score of the students are better than pretest score.
  • Range of the pretest score is 640 – 460 = 10 and the range of posttest score is 670 – 480 = 190. So the data of posttest score are more spread.
  • Mean of pretest score is 528 and the mean of posttest is 569.

Hence, we can say that Posttest scores of the students are better than the pretest score.

Median of pretest score is 515 and of posttest is 575.

Texas Go Math Grade 7 Lesson 12.3 Explore Activity 2 Answer Key  

Using Box Plots to Compare Populations

You can also compare two populations using random samples and box plots.
Texas Go Math Grade 7 Lesson 12.3 Answer Key 4

A survey of 7th graders asks girls and boys how many baseball caps they own.
Texas Go Math Grade 7 Lesson 12.3 Answer Key 5

A) Make a box plot for the number of baseball caps girls own.
Texas Go Math Grade 7 Lesson 12.3 Answer Key 6

B) Make a box plot for the number of baseball caps boys own.
Texas Go Math Grade 7 Lesson 12.3 Answer Key 7

C) Compare the box plots.
The plot for boys has a lesser /greater range, but a lesser/greater interquartile range. The middle 50% of caps was less spread out for the _____.

Reflect

Question 2.
What can you infer about the populations by comparing the box plots for the samples? Justify your answer.
Answer:
Comparing the dot plots of both sample we get information:

  • The median of girls is 7 and the median of the boys is 10. So the boys have more number of baseball caps as compared to girls.
  • Range of the girls is 18 – 3 = 15 and the range of boys is 18 – 7 = 11. So the data of girls sample are more spread.
  • Mean of pretest score is 7.4 and the mean of boys is 11.7. Hence, we can say that boys has more number of baseball caps as compared to girls baseball cap.

Median of girls is 7 and of boys it is 10.

Texas Go Math Grade 7 Lesson 12.3 Explore Activity 3 Answer Key  

You can use the means and ranges of two random samples to compare the populations that the random samples represent.

Paula and Daniel wanted to determine the average word length in two books. They took a random sample of 12 words each and counted the length of each word from each book.
Texas Go Math Grade 7 Lesson 12.3 Answer Key 8
Step 1
Calculate the mean for Book 1.
Texas Go Math Grade 7 Lesson 12.3 Answer Key 9
The mean for Book 1 is ______ letters long.
Step 2
Find the range for Book 1.
Texas Go Math Grade 7 Lesson 12.3 Answer Key 10
Subtract the least word length from the greatest word length.
Step 3
Calculate the mean for Book 2.
Texas Go Math Grade 7 Lesson 12.3 Answer Key 11
The mean for Book 2 is __ letters long.
Step 4
Find the range for Book 2.
___ + ___ = ____
Subtract the least word length from the greatest word length.

You can infer from the mean of each population that the overall average word length for Book 1 is less than/the same as/greater than the average word length for Book 2.
You can infer from the range of each population that the length of the words in Book 1 varies less than/in the same way as/more than

Reflect

Texas Go Math Grade 7 Answers Lesson 12.3 Answer Key Question 3.
What are the populations from which the samples were taken?
Answer:
It is given in the problem Paula and Daniel want to determine the average word length in two books so they take a random sample of 12 words from each book and count their length. Hence, here population will be all (each and every) the words in both books, from where Paula and Daniel randomly select 12 words to calculate the average length.
Hence, the population will be all the words in both books.

The population will be all the words in both books.

Texas Go Math Grade 7 Lesson 12.3 Guided Practice Answer Key  

Carol wants to know how many people live in each household in her town. She conducts two random surveys of 10 people each and asks how many people live in their homes. Her results are listed below. Use the data for 1 -6. (Explore Activities 1, 2 and 3)

Sample A: 1, 6, 2, 4, 4, 3, 5, 5, 2,8

Sample B: 3, 4, 5, 4, 3, 2, 4, 5, 4, 4

Question 1.
Make a dot plot for Sample A.
Texas Go Math Grade 7 Lesson 12.3 Answer Key 12
Answer:
Texas Go Math Grade 7 Lesson 12.3 Answer Key 18
All the blue dot represent the sample.

Question 2.
Make a dot plot for Sample B.
Texas Go Math Grade 7 Lesson 12.3 Answer Key 13
Answer:
Texas Go Math Grade 7 Lesson 12.3 Answer Key 14
All the red dot represent the sample.

Question 3.
Find the mean and range for Sample A.
Mean: ____ Range: _____
Answer:
Given sample A: 1, 6, 2, 4, 4, 3, 5, 5, 2, 8
Texas Go Math Grade 7 Lesson 12.3 Answer Key 20
Range = Maximum value – Minimum vaLue
= 8 – 1
Mean : 4
Range: 7

Texas Go Math Grade 7 Compare Populations Answer Key Question 4.
Find the mean and range for Sample A.
Mean: ____ Range: _____
Answer:
Given sample A:3, 4, 5, 4, 3, 2, 4, 5, 4, 4
Texas Go Math Grade 7 Lesson 12.3 Answer Key 21
Range = Maximum value – Minimum value
= 5 – 2
= 3
Mean:3.8
Range:3

Question 5.
What can you infer about the population based on Sample A? Explain.
Answer:
After plotting the Dot Plot of sample A in question 1 we can observe that the dot plot is almost symmetrical about 4 which means that the mean of given sample A is 4. And also the maximum number of people who lives in household is 8 and the minimum number is 1. So the range is 8 – 1 = 7. In most of the cases the number of people who lives in household are 2, 4, or 5.
The mean (4) and the range (7) of sample A is greater as compared to the sample B.

Mean and range of sample A is greater than sample B.

Question 6.
What can you infer about the population based on Sample B? Explain.
Answer:
After plotting the Dot Plot of sample B in question 2 we can observe that the dot plot is almost symmetrical about 4 which means that the mean of given sample B is near by 4. And also the maximum number of people who live in the household is 5 and the minimum number is 2. So the range is 5 – 2 = 3. But in most of cases the number of
people who live in the household are 4.
The mean (3.8) and the range (3) of sample B is smaller as compared to sample B.

The mean and range of sample B is smaller than sample A

Essential Question Check-in

Texas Go Math Grade 7 Answer Key Pdf Lesson 12.3 Question 7.
How can you use random samples to compare two populations?
Answer:
By using the random sample A and B we can conclude that:

  • In case of sample A, there are exact 4 people in the household of maximum people whereas in case of sample B the maximum household has people less than 4. So average number of people living in household in both case is 4.
  • Sample A has greater spread than Sample B which means that range of sample A is more than sample B. So number of people in household in sample A varies more rapidly than sample B.

By comparing the mean of random sample we can compare the average number of people in a household in both cases.

Texas Go Math Grade 7 Lesson 12.3 Independent Practice Answer Key  

The high school is buying shoes for the boy’s football team and boy’s soccer team. The sizes of a random sample of the players’ feet is shown.

Texas Go Math Grade 7 Lesson 12.3 Answer Key 14

Question 8.
Find the mean for both lists. What can you infer about the populations by comparing the means?
Answer:
Sample of football team shoe size: 6, 8, 9, 10, 10, 10, 10, 10, 11, 13
Sample of soccer team shoe size: 3, 5, 5, 6, 6, 6, 6, 6, 7, 8, 10
Texas Go Math Grade 7 Lesson 12.3 Answer Key 22
Average shoe size of team in case of football team is 9.82 but in case of soccer team the average shoe size of team 6.18.

Mean of football team is 9.82 and of soccer team is 6.18

Question 9.
Find the range of both lists. What can you infer about the populations by comparing the ranges?
Answer:
Sample of football team shoe size : 6, 8, 9, 10, 10, 10, 10, 10, 11, 13
Sample of soccer team shoe size: 3, 5, 5, 6, 6, 6, 6, 6, 7, 8, 10
Range of football team shoe size = Maximum value – Minimum value
= 13 – 6
= 7
Range of soccer team shoe size = Maximum value – Minimum value
= 10 – 3
= 7
Range of both football team and soccer team is same which is 7. This means that the spread of data (shoe size of both football and soccer team) are same in both case.

Range is same in both case.

7th Grade Plot Diagram Answer Key Go Math Practice Book Question 10.
Make a box plot for each sample.
Texas Go Math Grade 7 Lesson 12.3 Answer Key 15
Answer:
Texas Go Math Grade 7 Lesson 12.3 Answer Key 23
Texas Go Math Grade 7 Lesson 12.3 Answer Key 24
Box plot of both soccer and football team is shown.

Question 11.
Draw Conclusions Compare the box plots. What do you notice from the visual comparison?
Answer:
On comparing the box plot of both the team we can collude that the size of box in both case are same. Also the the size of both the whisker is same which means the range are same. And the central line (Median) in case of football team is greater than the soccer team.

Size of whisker is same in both case.

Mrs. Garcia asked a random sample of her students the number of books they read over the summer. Use these data for 12-14.

Texas Go Math Grade 7 Lesson 12.3 Answer Key 16

Question 12.
Make dot plots for each sample to illustrate the books read in each class.
Texas Go Math Grade 7 Lesson 12.3 Answer Key 17
Answer:
Texas Go Math Grade 7 Lesson 12.3 Answer Key 25
Texas Go Math Grade 7 Lesson 12.3 Answer Key 26
Maximum number of book read by both class A and Class B are 10

Question 13.
Describe two similarities and two differences between the dot plots.
Answer:

  • Two similarities between the dot plot of class A and B are :
    1. In both the clot plot the maximum value or maximum number of b00k read is lo.
    2. Spread of data in b0th the dot plot are almost similar.
  • Two differences between the dot plot of class A and B are
    1. Median of class A is 7.5 and class B is 3.5
    2. Minimum Number of book read by class A students is 1 but in case of class B students it is 2.

The median of class A is 7.5 and of class B is 3.5

Go Math 7th Grade Answer Key Pdf Lesson 12.3 Question 14.
Make a Conjecture Without doing any calculations, can you tell which class has read more books? Explain. What calculation would you perform to verify your response?
Answer:
Yes, we can tell which class has read more books without calculation.
By seeing the dot plot of both classes A and B we can say that class A has read more books than class B Because in the dot plot of class A the centre point (around which data are present) is between 7 and 8 but the dot plot of class B the centre point (around which data are present) is between 3 and 4.
Texas Go Math Grade 7 Lesson 12.3 Answer Key 27
Median of class A is 7.5 and of class B is 3.5

Texas Go Math Grade 7 Lesson 12.3 H.O.T. Focus On Higher Order Thinking Answer Key 

Question 15.
Communicate Mathematical Ideas Compare plotting points on a number line with plotting points on a dot plot.
Answer:
When any point is plotted on the number line, two variable x-coordinate and y-coordinate are needed and the y- coordinate of the point gives the value for corresponding value of x-coordinate. But in case of the dot plot each single dot represent the data from sample. If number of dot is more than one at single point then it means that data is repeated in the random sample
Texas Go Math Grade 7 Lesson 12.3 Answer Key 28
In dot plot each dot represent the data from random sample.

Question 16.
Analyze Relationships If you are given a box plot without any numbers on the number line, what can you tell about the data used to make the plot?
Answer:
Boxplot of any data tells or indicate that how the values of data from random sample are spread out. Box plot of any data indicate the median, range, maximum and minimum values of data sample. The box of box plot represent the upper and lower quartile of given data sample. So if boxplot is given without any numbers on number line we can only tells that how data from sample are distributed about the central point

If the whisker of the boxplot is larger, this means that data is largely spread out from the center point but if the whisker is very small or has no whisker this means most of the data are near the central point.

Boxplot indicates the median, range, max, and min value of the data sample.

Lesson 12.3 Using Proportional Relationships Answer Key Question 17.
Draw Conclusions Using at least ten points, create two distinct data sets with the same mean and range. Will their dot plots be the same? Could their box plots be the same?
Answer:
Let the first data sample be A: 2, 3, 7, 5, 5, 3, 8, 6, 5, 6
Texas Go Math Grade 7 Lesson 12.3 Answer Key 29
Range of sample A = Maximum value – Minimum value
= 8 – 2
= 6
The box plot of the given data sample is shown below:
Texas Go Math Grade 7 Lesson 12.3 Answer Key 30
Let the first data sample be B: 4, 5, 4, 4, 5, 4, 4, 6, 4, 10
Texas Go Math Grade 7 Lesson 12.3 Answer Key 31
Range of sample A = Maximum value – Minimum value
= 10 – 4
= 6
The box plot of the given data sample is shown below:
Texas Go Math Grade 7 Lesson 12.3 Answer Key 32
No, their dot plots cannot be the same because the dot plot depends on the value of data given in the sample.
No, their boxplot also cannot be the same because the maximum and minimum values of given data are different in both cases.

No, their dot plots cannot be the same.

Texas Go Math Grade 7 Lesson 12.3 Answer Key Comparing Populations Read More »

Texas Go Math Grade 7 Lesson 11.3 Answer Key Comparing Data Displayed in Box Plots

Refer to our Texas Go Math Grade 7 Answer Key Pdf to score good marks in the exams. Test yourself by practicing the problems from Texas Go Math Grade 7 Lesson 11.3 Answer Key Comparing Data Displayed in Box Plots.

Texas Go Math Grade 7 Lesson 11.3 Answer Key Comparing Data Displayed in Box Plots

Essential Question
How do you compare two sets of data displayed in box plots?

Texas Go Math Grade 7 Lesson 11.3 Explore Activity Answer Key  

Analyzing Box Plots
Box plots show five key values to represent a set of data, the least and greatest values, the lower and upper quartile, and the median. To create a box plot, arrange the data in order, and divide them into four equal-size parts or quarters. Then draw the box and the whiskers as shown.

The number of points a high school basketball player scored during the games he played this season are organized in the box plot shown.
Texas Go Math Grade 7 Lesson 11.3 Answer Key 1
Texas Go Math Grade 7 Lesson 11.3 Answer Key 2

A. Find the least and greatest values.
Least value: _______________ Greatest value: _________

B. Find the median and describe what it means for the data.

C. Find and describe the lower and upper quartiles.

D. The interquartile range is the difference between the upper and lower quartiles, which is represented by the length of the box. Find the interquartile range.
Q3 – Q1 = ___ – ___ = ____

Math Talk
Mathematical Processes
How do the lengths of the whiskers compare? Explain what this means.

Reflect

Go Math Grade 7 Lesson 11.3 Answer Key Question 1.
Why is one-half of the box wider than the other half of the box?
Answer:
In the box plot of data representation, the box represents 50% or one-half of the data and the center point is the median of the given data. Each smaller box with a median point as a divider represents 25% or one-fourth of the total data. So if one-half of the box is wider than the other half, this means that the spread of data or range of that half box is larger as compared to the other half box.
Range of wider box = 27.5 – 21 = 6.5
Range of smaller box = 21 – 17.5 = 3.5

The Spread of data in a wider box will be greater than smaller box.

Example 1.
The box plots show the distribution of times spent shopping by two different groups.
Texas Go Math Grade 7 Lesson 11.3 Answer Key 3

A. Compare the shapes of the box plots.
The positions and lengths of the boxes and whiskers appear to be very similar. In both plots, the right whisker is shorter than the left whisker.

B. Compare the centers of the box plots.
Group A’s median, 47.5, is greater than Group B’s, 40. This means that the median shopping time for Group A is 7.5 minutes more.

C. Compare the spreads of the box plots.
The box shows the interquartile range. The boxes are similar in length.
Group A: 55 – 30 = 25 min Group B: 59 – 32 = 27 min
The length of a box plus its whiskers shows the range of a data set. The two data sets have similar ranges.

Math Talk
Mathematical Processes
Which store has the shopper who shops longest? Explain how you know.

Reflect

Question 2.
Which group has the greater variability in the bottom 50% of shopping times? The top 50% of shopping times? Explain how you know.
Answer:
In box plot of data representation, the box represents 50% or one-half of the data and centre point is the
median of given data So left side of median or centre point represents bottom 50% of data and the right side
represents the top 50% of the data. Now calculating the top and bottom 50% of data.
For Group A:
Range of top 50% of data = Maximum value – Median
= 65 – 48
= 17
Range of bottom 50% of data = Median – Minimum value
= 48 – 5
= 43
For Group B:
Range of top 50% of data = Maximum value – Median
= 66 – 40
= 26
Range of bottom 50% of data = Median – Minimum value
= 40 – 8
= 32
Hence, Group A has greater variability is h. bottom 50% of the shopping times and Group B has greater variability in top 50% of shopping times.

Group A in botton 50%
Group B in top 50%

Your Turn

Question 3.
The box plots show the distribution of weights in pounds of two different groups of football players. Compare the shapes, centers, and spreads of the box plots.
Texas Go Math Grade 7 Lesson 11.3 Answer Key 4
Answer:
Comparing the shape, centre, and spread of the data in box plot:
Shape of box plots: Both right and left whisker of Group A is Longer as compared to whisker of Group B.
Center of box plots: Median or centre of group A is 249 and of Group B is 265. So median of the group B is more
than the median of group A.
Spread of box plots: Spread or range of the group A is more as compared to spread of group B. Also the size of
box of group A is longer than the group B which means that the interquartile range of group A will be greater than group B.

The median of group A is 249 and of group B is 250.

Example 2.
The box plots show the distribution of the number of team wristbands sold daily by two different stores over the same time period.
Texas Go Math Grade 7 Lesson 11.3 Answer Key 5
A. Compare the shapes of the box plots.
Store A’s box and right whisker are longer than Store B’s.
B. Compare the centers of the box plots.
Store A’s median is about 43, and Store B’s is about 51. Store A’s median is close to Store B’s minimum value, so about 50% of Store A’s daily sales were less than sales on Store B’s worst day.
C. Compare the spreads of the box plots.
Store A has a greater spread. Its range and interquartile range are both greater. Four of Store B’s key values are greater than Store A’s corresponding value. Store B had a greater number of sales overall.

Your Turn

Comparing Data Displayed in Box Plots Lesson 11.3 Answer Key Question 4.
Compare the shape, center, and spread of the data in the box plot with the data for Stores A and B in the two box plots in Example 2.
Texas Go Math Grade 7 Lesson 11.3 Answer Key 6
Answer:
Comparing the shape, center, and spread of the data in a box plot:
Shape of box plots: The right whisker of the given box pLot is longer than the right whisker of store B but smaller than the right wisher of store A
Center of box plots: The median or centre of given box plot is tata, median of store A is 43 and the median of store B is 51. The median of store B is the highest.
Spread of box plots: Spread or range of the given box plot is greater than the store B box plot but smaller than
the spread of the store A.

Median of given box plot is 44 and of store A is 43 and of store B is 51.

Texas Go Math Grade 7 Lesson 11.3 Guided Practice Answer Key  

For 1-3, use the box plot Terrence created for his math test scores. Find each value. (Explore Activity)

Question 1.
Minimum = ________ Maximum = ____
Answer:
On observing the given box plot Terrence of math test scores scores are: 72, 75, 79, 85, & 88.
Minimum = 72
Maximum = 88

Texas Go Math Grade 7 Lesson 11.3 Answer Key 7

Question 2.
Median = ___
Answer:
On observing the given box plot Terrence’s math test scores scores are:
72, 75, 79, 85, & 88.
Here total number of terms is 5 which is an odd number. We know that when a total number of terms is odd then the median of the given data is the middle term. So the median of the math test scores will be the 3rd term.
Median = 3rd term = 79

Comparing Box Plots Go Math Grade 7 Answer Key Pdf Question 3.
Range = __________ IQR = __________
Answer:
On observing the given box plot Terrence’s math test scores are:
72, 75, 79, 85, & 88.
Here, the range of math test scores by the students will be the difference between the maximum and minimum scores of the students.
Range = Max value – Min value = 88 – 72 = 16

For 4-7, use the box plots showing the distribution of the heights of hockey and volleyball players. (Example 1 and 2)

Texas Go Math Grade 7 Lesson 11.3 Answer Key 8

Question 4.
Which group has a greater median height? ________
Answer:
On observing the given box plot the heights of player are:
Hockey players: 64, 66, 70, 76, & 78.
Volleyball players: 67,68, 74, 78, & 85.
Here total number of term is 5 which is an odd number. We know that when total number of terms is an odd then the median of the given data is middle term. So the median of height of players will be the 3rd term.
Median of hockey player = 3rd term = 70
Median of volleyball player = 3rd term = 74
Hence, the median height of volleyball players are greater as compared to the median height of hockey players.

Question 5.
Which group has the shortest player? _____________ ______________
Answer:
On observing the given box plot the heights of the player are:
Hockey players: 64, 66, 70, 76, & 78.
Volleyball players: 67, 68, 74, 78, & 85.
Here on comparing the heights of both group hockey and volleyball players, we can see that the minimum height of a hockey player is 64 inches and the minimum height of a volleyball player is 67 inches. So the shortest player is 64 inches and belongs to the hockey group.
Hence, the hockey group has the shortest player 64 inches.

Lesson 11.3 Comparing Box Plots 7th Grade Question 6.
Which group has an interquartile range of about 10? __________________
Answer:
On observing the given box plot the heights of the player are:
Hockey players: 64, 66, 70, 76, & 78.
Volleyball players: 67, 68, 74, 78, & 85.
Here the box shows the interquartile range. The interquartile angle is the difference between the upper and lower quartile, which is represented by the length of the box
Interquartile range of hockey group = Q3 – Q1 = 78 – 68 = 10
Interquartite range of volleyball group = Q3 – Q1 = 76 – 66 = 10
Hence, both group has an interquartile range of 10

Both group has an interquartile range of 10

Essential Question Check-In

Question 7.
What information can you use to compare two box plots?
Answer:
By seeing and comparing box plot of both the data we can conclude :

  • The range of heights of volleyball group is greater then as compared to the hockey group.
  • The volleyball group has greater spread then hockey group.
  • Median of hockey group is greater.
  • Interquartile range of both group are same.

Volleyball group has greater spread

Texas Go Math Grade 7 Lesson 11.3 Independent Practice Answer Key  

For 8-11, use the box plots of the distances traveled by two toy cars that were jumped from a ramp.

Texas Go Math Grade 7 Lesson 11.3 Answer Key 9

Question 8.
Compare the minimum, maximum, and median of the box plots.
Answer:
The distance travelled by both car are:
Car A: 165, 170, 180, 195, 210
Car B: 160, 175, 185, 200, 205
Minimum and Maximum of Car A = 165 & 210
Minimum and Maximum of Car B = 160 & 205
The total number of terms in both cases is 5 which is odd and we know that in the case of an odd number, the median is the middle term. So 3rd term will be the median in both cases.
Median of car A = 180
Median of car B = 185

Go Math Comparing Data Displayed in Box Plots Lesson 11.2 Answer Key Question 9.
Compare the ranges and interquartile ranges of the data in box plots.
Answer:
The distance traveled by both car are:
Car A: 165, 170, 180, 195, 210
Car B: 160, 175, 185, 200, 205
We know that Range = Max value – Min value
Range of Car A = 210 – 165 = 45
Range of Car A = 205 – 160 = 45
Interquartile of car A = 195 – 170 = 25
Interquartite of car B = 200 – 175 = 25

Question 10.
What do the box plots tell you about the jump distances of two cars?
Answer:
On comparing the box Plots data of the two cars are:

  • The range of both cars A and B are the same which is 13.
  • The interquartile of both cars A and B are the same which is 25.
  • The median of the car B is greater as compared to the car A.

range and interquartile of both cars are the same.

Question 11.
Critical Thinking What do the whiskers tell you about the two data sets?
Answer:
The length of the whisker shows the range of the a data set.
The left whiskers of the car A is smaLler then the left whiskers of the car B and the right whiskers of car A is longer then the right whiskers of car B but over all length of the whiskers of both the car A and Car B is same. This means that the range of two data sets are same.

Range of two data sets are same.

For 12-14, use the box plots to compare the costs of leasing cars in two different cities.

Texas Go Math Grade 7 Lesson 11.3 Answer Key 10

Question 12.
In which city could you spend the least amount of money to lease a car? The greatest?
Answer:
The cost of leasing cars in two different cities are:
City A: 425, 450, 475, 550, 600
City B : 400, 425, 450, 475, 625
Mean of the cost in city A = \(\frac{425+450+475+550+600}{5}\)
= \(\frac{2500}{5}\)
= 500
Mean of the cost in city B = \(\frac{400+425+450+475+625}{5}\)
= \(\frac{2375}{5}\)
= 475
Hence, in City B it will take the least amount to lease a car and it City A it will take the greatest amount to lease a car.
Least in city B and greatest in city B.

Go Math Grade 7 Lesson 11.3 Answer Key Question 13.
Which city has a higher median price? How much higher is it?
Answer:
The cost of leasing cars in two different cities are:
City A: 425, 450, 475, 550, 600
City B: 400, 425, 450, 475, 625
Here total number of terms is 5 which is an odd number. And we know that the number of terms is odd then the median is middle term. So in this case the median will be the 5th term of the given data.
Median price of city A = 3rd term = 475
Median price of city b = 3rd term = 450
Hence, the median price of city A is higher as compared to the median price of the city B.
The median price of city A is higher.

Question 14.
Make a Conjecture In which city is it more likely to choose a car at random that leases for less than $450? Why?
Answer:
In city B it is more likely to choose a car at random that leases for less than $450.
Because in city A only two data shows that we can lease the car for $450 or less but in case of city B the three data shows that we can lease a car for $450 or less. So the chances of leasing a car for less than $450 is more in case of city B.

Question 15.
Summarize Look back at the box plots for 12-14 on the previous page. What do the box plots tell you about the costs of leasing cars in those two cities?
Answer:
On comparing the box plot of the city A and city B we can see that box of city A is longer than the box of city B. So the interquartile range of the city A is more as compared to the interquartile range of city B. This means that the cost of leasing a car in city B does not vary much at different place inside city and is around its median price which is $450 whereas in case of city A tile price for leasing a car varies much as compared to the median price of city A.

Median price of city A is higher than median price of city B

Texas Go Math Grade 7 Lesson 11.3 H.O.T. Focus On Higher Order Thinking Answer Key 

Question 16.
Draw Conclusions Two box plots have the same median and equally long whiskers. If one box plot has a longer box than the other box plot, what does this tell you about the difference between the data sets?
Answer:
In the box plot of data representation, the box represents 50% of the data and the left and right whiskers both represent the other 50% of the data.
If two box plots have the same median and equally long whiskers but one box is longer than the other box, then this means that the interquartile range (higher quartile – tower quartile) of the longer box data set must be greater than the interquartile range of the smaller box.

The longer box will have a greater interquartile range.

Question 17.
Communicate Mathematical Ideas What can you learn about a data set from a box plot? How is this information different from a dot plot?
Answer:
Using a box plot, you can determine the least and greatest values, the lower and upper quartiles, and the median
Furthermore, you could also determine the interquartile range (the difference between the upper and lower
quartile). The difference between the box plot and the dot plot is that the box plot shows the summary of the data set
while the dot plot shows all the values. For a dot plot, in order to determine the median, you still need to calculate it.
Also, dot plots only work in a small set of values while box plots work in large data sets.

The median, least, and greatest values and the lower and upper quartiles of a given data set

Question 18.
Analyze Relationships In mathematics, central tendency is the tendency of data values to cluster around some central value. What does a measure of variability tell you about the central tendency of a set of data? Explain.
Answer:
The measure of variability tells us how much diversity there is in a distribution of data, or how much is data scattered
from the central value.

The measure of variability is how much diversity there is in a distribution of data.

Texas Go Math Grade 7 Lesson 11.3 Answer Key Comparing Data Displayed in Box Plots Read More »

Scroll to Top