Prasanna

Texas Go Math Grade 2 Unit 6 Answer Key Personal Financial Literacy

Refer to our Texas Go Math Grade 2 Answer Key Pdf to score good marks in the exams. Test yourself by practicing the problems from Texas Go Math Grade 2 Unit 6 Answer Key Personal Financial Literacy.

Texas Go Math Grade 2 Unit 6 Answer Key Personal Financial Literacy

Show What You Know
Check your understanding of important skills.

Pennies and Dimes

Texas Go Math Grade 2 Unit 6 Answer Key 3

Write the total value of the coins.

Question 1.
Texas Go Math Grade 2 Unit 6 Answer Key 1
Answer: 3 pennies

Explanation:
3 x 1 penny = 3
The total value of the coins is 3

Question 2.
Texas Go Math Grade 2 Unit 6 Answer Key 2
Answer: 2 dimes
Explanation:
2 x 1dime = 3
The total value of the coins is 2 dimes

One Dollar
Circle coins to make $1.00. Cross out the coins you do not use.

Question 3.
Texas Go Math Grade 2 Unit 6 Answer Key 4
Answer:

Explanation:
3 x 25 = 75
2 x 10 = 20
1 x 5 = 5
75 + 20 + 5 = 100 cents = $1.
Explanation:
Circled which are used and crossed out which are not used

Model and Record 2-Digit Subtraction

Draw a quick picture to solve. Write the difference.

Question 4.
Texas Go Math Grade 2 Unit 6 Answer Key 5
Answer:

Explanation:
The given problem is converted as tens and ones
so we can find the difference easy

Question 5.
Texas Go Math Grade 2 Unit 6 Answer Key 6
Answer:

Explanation:
The given problem is converted as tens and ones
so we can find the difference easy

Vocabulary Builder

Visualize it

Fill in the boxes of the graphic organizer with the name for each coin.

Texas Go Math Grade 2 Unit 6 Answer Key 7
Answer:

Explanation:
Written the names for the coins

Understand Vocabulary

Write a review word to complete each sentence.

Texas Go Math Grade 2 Unit 6 Answer Key 8

Question 1.
A ____________________ has a value of 10 cents.
Answer: Dime
Explanation:
A Dime  has a value of 10 cents.

Question 2.
A __________________ has a value of I cent.
Answer: Penny
Explanation:
A Penny has a value of I cent.

Question 3.
A ____________________ has a value of 25 cents.
Answer: Quarter Dollar
Explanation:
A Quarter Dollar has a value of 25 cents.

Question 4.
A _____________________ has a value of 5 cents.
Answer: Nickel
Explanation:
A Nickel has a value of 5 cents.

Vocabulary Reader

Ten Eggs in a Basket

written by J. D. McDonnell
illustrated by Sofia Baizola

This Take-Home Book belongs to

Texas Go Math Grade 2 Unit 6 Answer Key 9

Texas Go Math Grade 2 Unit 6 Answer Key 10
Ben’s hens lay eggs a great amount.
So many eggs that you can count.

Texas Go Math Grade 2 Unit 6 Answer Key 11

Ben sells eggs in baskets of ten.
Each one laid by a noisy hen.

How many eggs are on the top shelf?
Answer: 20 eggs
How many eggs are on the bottom shelf?
Answer: 30 eggs
How many eggs are for sale in all?
Answer: 30 + 20 = 50 eggs are in sale

Texas Go Math Grade 2 Unit 6 Answer Key 12

Each day Ben collects eggs.
He puts them in baskets of ten.
Baskets of eggs hell sell.
To women and men.

Texas Go Math Grade 2 Unit 6 Answer Key 13

Draw lines around groups of ten eggs.

How many baskets will Ben need? ____
Answer:
Ben needs 10 baskets

Texas Go Math Grade 2 Unit 6 Answer Key 18

One night a fox came to the henhouse door.
It worried the hens.
Fewer eggs were laid than the day before.
How many eggs were laid that day? ____
17 eggs were laid that day.

Texas Go Math Grade 2 Unit 6 Answer Key 14


Price for each basket is written

But the fox never returned, And so relieved were Ben’s hens, That they soon laid huge numbers of eggs Eggs by the tens!

Texas Go Math Grade 2 Unit 6 Answer Key 15

Three of Ben’s hens laid lots of eggs.
Let’s make a count.
Circle groups of tens to find out.
How many eggs did each lay?
Lisa __ Penny ___ Helen ___
Answer:
Lisa lays 10 eggs
Penny lays 30 eggs
Helen lays 20 eggs

Write about the Math

Write Math Look at the picture of Ben and the eggs he sells. Draw and write your own story about selling something in groups of tens.

Texas Go Math Grade 2 Unit 6 Answer Key 16

Groups of Tens
Use the picture to answer the questions.

Texas Go Math Grade 2 Unit 6 Answer Key 17

Question 1.
Circle groups of 10 eggs on the tables. How many groups of 10 eggs are there?
___ groups of 10 eggs
Answer:

Explanation:
10 groups of 10 eggs.
Circled groups of 10 eggs on the tables

Question 2.
How many eggs are there in all?
____ eggs
Answer:
10 x 10 = 100 eggs
Explanation:
circled group of 10 eggs 10 times

Question 3.
How many eggs are on each table?
_____ eggs
Answer: 50 eggs
Explanation:
Circled 5 times
5 x 10 = 50

Question 4.
If you were to skip count by 10s to find the total number of eggs on the tables, what counting pattern would you say?
Answer:
10 x 10 = 100
10 +10 + 10 + 10 + 10 + 10 + 10 + 10 + 10 + 10 = 100

Math Board Write a story problem about selling eggs. Use $1 as the selling price for each group of 10 eggs in your story. Have a classmate solve your problem.
Explanation:
Mrs. Jim had 100 eggs. he sells the eggs $1 for 10 eggs if they buy 50
Kate want to buy 50
5 sets of ten eggs
5 x 1 = $5 Kate want to spend to buy 50 eggs.

Texas Go Math Grade 2 Unit 6 Answer Key Personal Financial Literacy Read More »

Texas Go Math Grade 2 Unit 5 Assessment Answer Key

Refer to our Texas Go Math Grade 2 Answer Key Pdf to score good marks in the exams. Test yourself by practicing the problems from Texas Go Math Grade 2 Unit 5 Assessment Answer Key.

Texas Go Math Grade 2 Unit 5 Assessment Answer Key

Concepts and Skills

Question 1.
Use the tally chart to complete the pictograph. Draw a Texas Go Math Grade 2 Unit 5 Assessment Answer Key 1 for each bird. TEKS 2.10.B
Texas Go Math Grade 2 Unit 5 Assessment Answer Key 2
Answer:

Explanation:
Used the tally chart to complete the pictograph.
Drawn a Texas Go Math Grade 2 Unit 5 Assessment Answer Key 1 for each bird.

Texas Go Math Grade 2 Unit 5 Answer Key Question 2.
Use the pictograph. How many birds did Kate count? TEKS 2.10.A
_____ birds
Answer: 5 birds
Explanation:
Kate counted 5  birds in all

Question 3.
Use the data in the graph. Write a problem that you would use addition or subtraction to solve. Then solve. TEKS 2.10.C
Answer: Kate counted 5 and Ted counted 2. How many birds do they count altogether
5 + 2 = 7
Explanation:
Written an equation by using the addition.

Fill in the bubble for the correct answer choice.

Question 4.
The bar graph shows the marbles that Bev put into a bag. How many more blue marbles than green marbles are there? TEKS 2.10.A.
Texas Go Math Grade 2 Unit 5 Assessment Answer Key 3 3
Texas Go Math Grade 2 Unit 5 Assessment Answer Key 3 2
Texas Go Math Grade 2 Unit 5 Assessment Answer Key 3 4
Texas Go Math Grade 2 Unit 5 Assessment Answer Key 4
Answer: 2
Explanation:
2 more blue marbles than green marbles are there.
3 – 1 = 2

Unit 5 Go Math Test 2nd Grade Answer Key Question 5.

The bar graph shows the snowfall in Sara’s town. Which describes the change that the data shows? TEKS 2.10.D.
Texas Go Math Grade 2 Unit 5 Assessment Answer Key 3 The amount of snow stayed the same.
Texas Go Math Grade 2 Unit 5 Assessment Answer Key 3 The amount of snow decreased.
Texas Go Math Grade 2 Unit 5 Assessment Answer Key 3 The amount of snow increased.
Answer: The amount of snow increased.
Explanation:
The change that the data shows is The amount of snow increased.

Texas Test Prep

Fill in the bubble for the correct answer choice.

Question 6.
Mr. Green made this pictograph. How many fewer books did Joy read than Tony? TEKS 2.10.A
Texas Go Math Grade 2 Unit 5 Assessment Answer Key 5
Texas Go Math Grade 2 Unit 5 Assessment Answer Key 3 4
Texas Go Math Grade 2 Unit 5 Assessment Answer Key 3 2
Texas Go Math Grade 2 Unit 5 Assessment Answer Key 3 3
Answer: 3
Explanation:
Joy read 1 book and tony read 4 books
4 – 1 = 3 fewer books has Joy read than Tony

Question 7.
How many cards did Fran make? TEKS 2.10.B
Texas Go Math Grade 2 Unit 5 Assessment Answer Key 3 8
Texas Go Math Grade 2 Unit 5 Assessment Answer Key 3 10
Texas Go Math Grade 2 Unit 5 Assessment Answer Key 3 6
Texas Go Math Grade 2 Unit 5 Assessment Answer Key 6
Answer: 6 cards
Explanation:
Fran make 3 x 2= 6 cards

Go Math 2nd Grade Unit 5 Assessment Answer Key Question 8.
Use the bar graph. How many mums are in the basket? TEKS 2.10.B
Texas Go Math Grade 2 Unit 5 Assessment Answer Key 7
Texas Go Math Grade 2 Unit 5 Assessment Answer Key 3 8
Texas Go Math Grade 2 Unit 5 Assessment Answer Key 3 4
Texas Go Math Grade 2 Unit 5 Assessment Answer Key 3 6
Answer: 8
Explanation:
There are 8 mums in the basket

Use this information to solve.

  • There are 12 marbles in the jar.
  • There are the same number of red marbles and blue marbles.

Texas Go Math Grade 2 Unit 5 Assessment Answer Key 8

Question 9.
Draw bars in the graph for the red marbles and blue marbles. TEKS 2.1o.
Answer:

Explanation:
There are 12 marbles in the jar.
There are the same number of red marbles and blue marbles.
Yellow and green combined is 4
12 – 4 = 8
as they are same each has 4

Go Math Answer Key Grade 2 Unit 5 Test Answers Question 10.
Explain how you decided how long the bars should be for red marbles and blue marbles. TEKS 2.10.A
Answer: Yellow and green combined is 4
12 – 4 = 8
as they are same each has 4
Explanation:
Yellow and green combined is 4
12 – 4 = 8
as they are same each has 4

Question 11.
Write three sentences to describe and compare the data in the bar graph. TEKS 2.10.A
Answer:  the 3 statements are stated below
Explanation:
Yellow and green combined is 4
There are the same number of red marbles and blue marbles.
red marbles and blue marbles is 8

Texas Go Math Grade 2 Unit 5 Assessment Answer Key Read More »

Texas Go Math Grade 2 Lesson 19.7 Answer Key Conclusions and Predictions

Refer to our Texas Go Math Grade 2 Answer Key Pdf to score good marks in the exams. Test yourself by practicing the problems from Texas Go Math Grade 2 Lesson 19.7 Answer Key Conclusions and Predictions.

Texas Go Math Grade 2 Lesson 19.7 Answer Key Conclusions and Predictions

Essential Question
How can you use data from a graph to draw conclusions and make predictions?
Explanation:
Students must be able to draw conclusions and make predictions based on the information given in a bar graph or pictograph.
Conclusions may be inferred, numerical, written, or comparative.
Predictions may be based on patterns within the data,
show future trends, or compare sets of data.

Explore
Draw to complete the graph. Then use the graph to solve.
Texas Go Math Grade 2 Lesson 19.7 Answer Key 1
Nathan worked more hours in Week ______ than Week ___.

Explanation:
Nathan worked more hours in Week 4 than Week 3.

Math Talk
Mathematical Processes
Describe how you used the bar graph to solve the problem.
Explanation:
With the help of bar diagram.
Nathan worked more hours in Week 4 than Week 3.

For The Teacher

  • Read the following problem. In Week 1, Nathan worked on his project for 1 hour. In Week 2, he worked on his project for 2 hours. In Week 3, he worked on his project for 4 hours. In Week 4, Nathan worked 3 hours on his project. Did Nathan work more hours on his project in Week 3 or Week 4?
    Explanation:
    Nathan worked more hours on Week 3.

Model and Draw
Use the data to make a conclusion.
Describe the change that the data shows.

Predict. How tall do you think the plant will be in Week 5?
Texas Go Math Grade 2 Lesson 19.7 Answer Key 2
The height of the plant _______
Explanation:
The height of the plant must be 8

Share and Show

Go Math 2nd Grade Answer Key Lesson 9.7 Question 1.
Use the graph. Describe the change that the data shows.
Texas Go Math Grade 2 Lesson 19.7 Answer Key 3
The amount of rainfall _______
Answer:
The amount of rainfall decreases by 1 inch from may to august
Explanation:
According o the graph
The amount of rainfall decreases by 1 inch from may to august

Problem Solving

Use the graph to solve.

Question 2.
H.O.T. Multi-Step Describe the change that the data shows.
The weight of the puppy ___________
Predict. How many pounds will the puppy weigh in Week 5?
___ ponds
Texas Go Math Grade 2 Lesson 19.7 Answer Key 4
Texas Go Math Grade 2 Lesson 19.7 Answer Key 5
Answer:
The weight of the puppy increases by 1 pound in week 1 and week 2
increases by 2 pounds in week 3 increases by 1 pound in week 4
Explanation:
According to this in week 5 it should  increase by 2
puppy weigh in Week 5 might be 7 pounds.

Use the graph to solve.

Question 3.
Bianca is learning to play the guitar. Describe the change that the data shows.
Texas Go Math Grade 2 Lesson 19.7 Answer Key 6
The amount of practice time
Answer:
The amount of practice time increases by 1 hour from week 1 to week 4.
Week 2 to Week 3 the practice time increased 2 hours
Explanation:
Bianca is learning to play the guitar
she increased the practice time

Go Math Grade 2 Answer Key Lesson 9.7 Question 4.
Multi-Step Why do you think the number of hours changed from week to week?

Predict. How many hours might Bianca practice in Week 5? ___ hours
Answer:  2 hours might Bianca practice in Week 5
Explanation:
As the practice time increase the hours change from week to week.

Daily Assessment Task

Use the graph to solve.

Ginger ‘is learning to write poems.

Texas Go Math Grade 2 Lesson 19.7 Answer Key 8

The bar graph shows how many poems she writes for 4 weeks.

Question 5.
Why do you think the number of poems changed from week to week?
Predict. How many poems might Ginger write in Week 5? _______ poems
Answer: 8 poems
Explanation:
Rather than week 1 the remaining weeks she wrote 2 poems per week
so, according to this information Ginger must write 2 poems in week 5.

Question 6.
Texas Test Prep Use the bar graph above.
Which describes the change that the data shows?
(A) The number of poems decreases.
(B) The number of poems stays the same.
(C) The number of poems increases.
Answer: C
Explanation:
The number of poems increased by 2 week to week

Texas Go Math Grade 2 Lesson 19.7 Homework and Practice Answer Key

Go Math Answer Key Grade 2 Lesson 9.7 Question 1.
Use the graph to solve. Describe the change that the data shows.
The amount of snowfall _____
Texas Go Math Grade 2 Lesson 19.7 Answer Key 9
Answer:
The amount of snowfall Increased
Explanation:
According to the graph
The snow fall is increased by 2 inches from January to February.

Problem Solving

Use the graph to solve.

Question 2.
Multi-Step Jonathan is learning to play the piano. Describe the change that the data shows.
Texas Go Math Grade 2 Lesson 19.7 Answer Key 10
The amount of practicing time
Answer:
The amount of practicing time increasing from week to Week
Explanation:
Jonathan is learning to play the piano.
He increased the practice by 2 hours from week 3 to week 4

Texas Test Prep

Lesson Check

Choose the correct answer.

Texas Go Math Grade 2 Graphing and Conclusions Answer Key Question 3.
Eddie measured the growth of the flower for 4 weeks. What is the height of the flower at Week 3?
Texas Go Math Grade 2 Lesson 19.7 Answer Key 13
(A) 8 inches
(B) 4 inches
(C) 6 inches
Answer: C
Explanation:
The height of the flower at Week 3 is 6 inches

Question 4.
Eddie predicts the height at Week 5. Which is the best prediction?
(A) 6 inches
(B) 9 inches
(C) 1 inches
Answer: B
Explanation:
According to the graph the flower is growing but not decreasing
so, Eddie predicts the height at Week 5 as 9.

Go Math 2nd Lesson 19.7 Homework Answers Question 5.
Which describes the change that the data shows?
(A) The height of the flower increases.
(B) The height of the flower stays the same.
(C) The height of the flower decreases.
Answer: A
Explanation:
The height of the flower increases by 2 inches from week to week.

Texas Go Math Grade 2 Lesson 19.7 Answer Key Conclusions and Predictions Read More »

Texas Go Math Grade 2 Lesson 19.6 Answer Key Graphs: Scales of 2 or More

Refer to our Texas Go Math Grade 2 Answer Key Pdf to score good marks in the exams. Test yourself by practicing the problems from Texas Go Math Grade 2 Lesson 19.6 Answer Key Graphs: Scales of 2 or More.

Texas Go Math Grade 2 Lesson 19.6 Answer Key Graphs: Scales of 2 or More

Essential Question
How can you make a graph that uses a scale of 2 or more?

  1. Choose an appropriate scale for the x- and y-axis.
  2. Plot the points accurately.
  3. Label the both axes including a brief description of the data and the units.
  4. Give your graph a suitable title.
  5. State the source of data

Explore
Use the graph to solve.
Texas Go Math Grade 2 Lesson 19.6 Answer Key 1
___ brown dogs
Explanation:
There are 7 brown dogs

For The Teacher

  • Read the following problem. Jason and his dad went to the park. They saw these dogs at the park. How many brown dogs did they see at the park?
    Answer:
    They saw 7 Brown dogs in the park.

Math Talk
Mathematical Processes
How many brown dogs and white dogs are at the park? Explain.
Answer: 10
Explanation:
There are 7 Brown dogs and 3 white dogs
so, there are 10 dogs and white dogs are at the park.

Model and Draw
Use the data in the bar graph to make a pictograph. Look closely at the scale and key of the graphs.
Texas Go Math Grade 2 Lesson 19.6 Answer Key 2
Explanation:
The pictograph is done

Share and Show

Question 1.
Use the data in the pictograph to make a bar graph.
Texas Go Math Grade 2 Lesson 19.6 Answer Key 3
Answer:

Question 2.
How many ladybugs are in the garden? ____ ladybugs
Answer: 4 lady bugs
Explanation:
There are 4 ladybugs in the garden

Question 3.
How many more bees than ladybugs are in the garden? ____ more bees
Answer: 2 more bees
bees = 6
ladybugs = 4
6 – 4 = 2
Explanation:
There are 2 more bees than ladybugs

Problem Solving

Question 4.
H.O.T. Multi-Step Use the data in the bar graph to make a pictograph.
Texas Go Math Grade 2 Lesson 19.6 Answer Key 5
Answer:

Question 5.
Look at the graphs above. Ted thinks that 2 more children chose dog than bird. Is Ted correct? Explain.
Answer: No
Explanation:
By the graph we can see that
The children chose bird is 10
and the children who chose dog are 20
so, Dogs 10 more than the bird.

Daily Assessment Task

Follow the directions.

Question 6.
Use the key. Draw pictures in the pictograph to show the data.
There are 10 white cats Cots at the cat show.

There are 6 black cats at the cat show.

There are 4 brown cats at the cat show.

Texas Go Math Grade 2 Lesson 19.6 Answer Key 6

Choose the correct answer.

Question 7.
Representations Use the pictograph. How many fewer brown cats than black cats are at the cat show?
(A) 4
(B) 1
(C) 2
Answer: C
Number of brown cats = 4
Number of black cats = 6
6 – 4 = 2

Go Math Grade 2 Lesson 19.6 Answer Key Question 8.
Texas Test Prep Use the bar graph. How many books did Noah read?
Texas Go Math Grade 2 Lesson 19.6 Answer Key 7
(A) 3
(B) 6
(C) 4
Answer: B
Explanation:
Noah read 6 books.

Texas Go Math Grade 2 Lesson 19.6 Homework and Practice Answer Key

Question 1.
Use the data in the pictograph to make a bar graph.
Texas Go Math Grade 2 Lesson 19.6 Answer Key 8
Answer:

Explanation:
With the help of pictograph bar graph was done.

Question 2.
How many children chose puppy or bear?
___ children
Answer:  30 children
Explanation:
30 children chose puppy or bear
puppy = 10
Bear = 20
20 + 10 = 30

Problem Solving

Use the graphs above.

Question 3.
Multi-Step Andy thinks that I fewer child chose kitten than bear. Is Andy correct? Explain.
Answer: No,
Explanation:
Andy thinks that I fewer child chose kitten than bear.
but Number of kittens are 15
and number of bears are 20
20 – 15 = 5
so , 5 fewer bears

Texas Test Prep

Lesson Check

Choose the correct answer.

Question 4.
Uše the bar graph. How many flag stickers does Kyle have?
Texas Go Math Grade 2 Lesson 19.6 Answer Key 9
(A) 3
(B) 6
(C) 4
Answer: C
Explanation:
Kyle have 4 fewer stickers

Rosa makes a pictograph to record the color of bikes she sees at the park.
Texas Go Math Grade 2 Lesson 19.6 Answer Key 10

Question 5.
There are 8 black bikes at the park. How many Texas Go Math Grade 2 Lesson 19.6 Answer Key 11 will Rosa draw to show the black bikes?
Texas Go Math Grade 2 Lesson 19.6 Answer Key 11 8
Texas Go Math Grade 2 Lesson 19.6 Answer Key 11 2
Texas Go Math Grade 2 Lesson 19.6 Answer Key 11 4
Answer:  4
Explanation:
She draw 4 because 4 x 2 = 8
Texas Go Math Grade 2 Lesson 19.6 Answer Key 11 = 2

Question 6.
Rosa draws 3 Texas Go Math Grade 2 Lesson 19.6 Answer Key 11 in the row for pink bikes. How many pink bikes does she see at the park?
(A) 6
(B) 2
(C) 3
Answer:  A
Explanation:
She draw 3 because 3 x 2 = 6
Texas Go Math Grade 2 Lesson 19.6 Answer Key 11 = 2

Texas Go Math Grade 2 Lesson 19.6 Answer Key Graphs: Scales of 2 or More Read More »

Texas Go Math Grade 2 Lesson 19.5 Answer Key Use Data to Write Problems

Refer to our Texas Go Math Grade 2 Answer Key Pdf to score good marks in the exams. Test yourself by practicing the problems from Texas Go Math Grade 2 Lesson 19.5 Answer Key Use Data to Write Problems.

Texas Go Math Grade 2 Lesson 19.5 Answer Key Use Data to Write Problems

Essential Question
How can you write and solve a problem about data in a graph?
Explanation:

  1. Understand the Problem.
  2. Devise a Plan—Translate: Make a graph.
  3. Carry Out the Plan—Solve: Use the graph to answer the question asked.
  4. Look—Check and Interpret.

Explore
Use the data to make a pictograph.

Texas Go Math Grade 2 Lesson 19.5 Answer Key 1

For The Teacher Read the following problem. The teacher has 5 yellow pencils in a box. She has 4 red pencils in the box. She has 1 purple pencil in the box. She has 3 blue pencils in the box. How many fewer purple pencils than red pencils are there in the box?

Math talk
Mathematical Processes
Explain how you used the graph to answer question.
The data in the bar graph shows the information

Model and Draw

What story problems could you ask about the data?
Four children read some books. How many books did Craig and Kyle read?
Texas Go Math Grade 2 Lesson 19.5 Answer Key 2
Answer: ___ books
7 books
Explanation:
Craig read 4 books
and Kyle read 3 books

How many more books did _______
read than _____________ ?
Answer: ___ more books
Explanation: 1 more books
How many more books did Lori read than Paula
5 – 4 = 1
1 more book Lori read than Paula

Share and Show

Write a question that the graph could be used to solve. Then solve.
Texas Go Math Grade 2 Lesson 19.5 Answer Key 3

Texas Go Math Grade 2 Pdf Lesson 19.5 Answer Key Question 1.
Children voted for their favorite pet.
Answer:
Total children voted for their favorite pet is 12
Explanation:
How many Children voted more chose dog than the fish
Children chose dog is 5
Children chose fish is 2
5 – 2 = 3
3 more children voted dog than fish

Problem Solving

Write a question that the graph ‘could be used to solve. Then solve.
Texas Go Math Grade 2 Lesson 19.5 Answer Key 4

Question 2.
We saw these animals at the park.
Answer: Squirrels, Chipmunk, Rabbit, Robin
are the animals which we see in the park

Question 3.
Multi-Step Write a question about the data ¡n the graph above that you could use this addition sentence to solve.
Texas Go Math Grade 2 Lesson 19.5 Answer Key 5
Answer: Kate went to see the animals to zoo he saw Chipmunk and Robin. How many did Kate see altogether
Number of chipmunk are 3
Number of robins are 2
3 + 2 = 5

Go Math Grade 2 Answer Key Pdf Lesson 19.5 Question 4.
H.O.T. Look at the bars in the bar graph. What do you know about the data just by looking at the different lengths of bars?
Answer: Number of animals in the park
Are there in the park?
The data is about the number of animals in the park

Daily Assessment Task

Use the bar graph to complete.
Texas Go Math Grade 2 Lesson 19.5 Answer Key 6

Question 5.
Use the data in the bar graph. Write a problem that you would use addition or subtraction to solve. Then solve. Ray has these toy cars.
Answer:
Ray has 4 red cars and 3 blue cars
how many did he have altogether
Explanation:
4 + 3 = 7
Ray has 7 cars altogether.

Question 6.
Texas Test Prep Use the bar graph above. Which question could you use the bar graph to solve?
(A) How many cars are the same size?
(B) How many toy cars does Ray have?
(C) Who has more red cars than Ray?
Answer: B
Explanation:
How many toy cars does Ray have?
the bar graph shows about the above information.

Texas Go Math Grade 2 Lesson 19.5 Homework and Practice Answer Key

Write a question that the graph could be used to solve. Then solve.

Question 1.
Mia picked these flowers.
Texas Go Math Grade 2 Lesson 19.5 Answer Key 7
Answer: _______________________
Rose, Tulip, Daisy, Lily
Explanation:
Rose, Tulip, Daisy, Lily are the 4 types of flowers that
Mia picked.

Problem Solving

Use the bar graph above.

Question 2.
Multi-Step Write a question that you could use this addition sentence to solve.
Texas Go Math Grade 2 Lesson 19.5 Answer Key 8
Answer: Mia picked some lilies and some tulips. What the Mia pick altogether?
Explanation:
Lily is 4 and Tulip is 7
4 + 7 = 11
Mia picked 11 flowers altogether.

Lesson 19.5 Answer Key Texas Go Math Grade 2 Question 3.
Multi-Step Look at the bars in the bar graph. What do you know about the data just by looking at the different lengths of bars?
Answer: Number of flowers picked up by Mia
Explanation:
We know about the data just by looking at the different lengths of bars is Flowers picked up by Mia.

Texas Test Prep

Lesson Check

Choose the correct answer.

Texas Go Math Grade 2 Lesson 19.5 Answer Key 9

Question 4.
Adam walks to school. How many other children walk to school?
(A) 2
(B) 4
(C) 3
Answer: A
Explanation:
4 other children walk to school. According to a bar graph.

Go Math Grade 2 Lesson 19.5 Homework Answers Question 5.
Beth goes to school the way most of the other children go to school. How does she go to school?
(A) walk
(B) bike
(C) bus
Answer: C
Explanation:
The way most of the other children go to school is by bus.
So, Beth also goes to school by bus.

Question 6.
Which question could you use the pictograph to answer?
(A) Which children get to school by car?
(B) How many more children would like to walk to school?
(C) How many children bike to school?
Answer: B
Explanation:
5 more children like to go to school by walk.

Texas Go Math Grade 2 Lesson 19.5 Answer Key Use Data to Write Problems Read More »

Texas Go Math Grade 2 Lesson 19.4 Answer Key Make Bar Graphs

Refer to our Texas Go Math Grade 2 Answer Key Pdf to score good marks in the exams. Test yourself by practicing the problems from Texas Go Math Grade 2 Lesson 19.4 Answer Key Make Bar Graphs.

Texas Go Math Grade 2 Lesson 19.4 Answer Key Make Bar Graphs

Essential Question
How do you make a bar graph to show data?
Explanation:
A bar graph is a graph that shows complete data with rectangular bars and the heights of bars are proportional to the values that they represent.

Explore
Use the bar graph to solve the problem. Draw or write to show what you did.
Texas Go Math Grade 2 Lesson 19.4 Answer Key 1
__ writing tools

For The Teacher

  • Read the following problem. Barry made this bar graph, How many writing tools are in the box’

Explanation:
4 writing tools
according to the bar graph.
Math Talk

Mathematical processes
What do the lengths of the bars in the graph show for crayon and marker? Explain.
Explanation:
crayon = 4
and marker = 3 the lengths of the bars in the graph

Model and Draw
Complete the bar graph to show this data.

  • Abel read 2 books.
  • Brad read 4 books.
  • Cara read I book.
  • Lynn read 3 books.

Texas Go Math Grade 2 Lesson 19.4 Answer Key 2
Explanation:

Explanation:
Bar graph is done with the help of the data.

Share and Show

Ella is making a bar graph to show the kinds of pets her classmates have.

  • 5 classmates have a dog.
  • 7 classmates have a cat.
  • 2 classmates have a bird.
  • 3 classmates have fish.

Texas Go Math Grade 2 Lesson 19.4 Answer Key 3
Explanation:

Go Math Answer Key Grade 2 Bar Graph Question 1.
Write labels and draw bars to complete the graph.
Answer:

Explanation:
Written the labels and completed the bar graph.

Question 2.
How will the graph change if one more child gets a bird?
Answer:

Explanation:
The graph of the bird will increase to 3
2 + 1 = 3

Problem Solving

Dexter asked his classmates which pizza topping is their favorite.

  • 4 classmates chose peppers.
  • 7 classmates chose meat.
  • 5 classmates chose mushrooms.
  • 2 classmates chose olives.

Texas Go Math Grade 2 Lesson 19.4 Answer Key 4

Question 3.
Write a title and labels for the bar graph. Draw bars to show the data.
Texas Go Math Grade 2 Lesson 19.4 Answer Key 5
Answer:

Explanation:
Completed the graph and written the labels.

Go Math Grade 2 Use Bar Graphs Lesson 19.4 Answer Key Question 4.
Multi-Step Did more classmates choose peppers and olives than meat? Explain.
Answer:

4 classmates chose peppers.
2 classmates chose olives.
4 + 2 = 6
7 classmates chose meat.
7 > 6
Yes, classmates choose peppers and olives over meat.

Question 5.
H.O.T. Multi-Step Which three toppings were chosen by a total of 13 children?
Answer: Meet. olives. and peppers.
Explanation:

7 classmates chose meat.
2 classmates chose olives.
4 classmates chose peppers.
7 + 2 + 4 = 13

Daily Assessment Task

Follow the directions.

Question 6.
Draw bars in the graph to show this data. 6 children chose bear. 4 children chose lion. 7 children chose tiger. 3 children chose zebra.
Texas Go Math Grade 2 Lesson 19.4 Answer Key 6
Answer:

Explanation:
A bar graph is completed with the help of data.

Choose the correct answer.

Bar Graph 2nd Grade Go Math Answer Key Question 7.
Analyze How many children voted for their favorite zoo animal.
(A) 20
(B) 8
(C) 16
Answer: A
Explanation:
20 children voted for their favorite zoo animal.

Question 8.
Texas Test Prep Look at the bar graph above. Which animal did the most children choose?
(A) bear
(B) Tiger
(C) zebra
Answer: B
Explanation:
The most children chose Tiger as there favorite Zoo animal

Texas Go Math Grade 2 Lesson 19.4 Homework and Practice Answer Key

Make Bar Graphs

Andy asked his classmates which sandwich is their favorite.

  • 3 classmates chose cheese.
  • 8 classmates chose peanut butter.
  • 6 classmates chose turkey.
  • 2 classmates chose ham.

Question 1.
Write a title and labels for the bar graph. Draw bars to show the data.
Texas Go Math Grade 2 Lesson 19.4 Answer Key 7
Answer:
Texas-Go-Math-Grade-2-Lesson-19.4-Answer-Key-7
Explanation:
Written the title and labels for the bar graph as we can observe in the above image. A bar graph is completed with the help of data.

Problem Solving

Go Math 2nd Grade Answer Key Bar Graph Question 2.
Multi-Step Did more children choose cheese or ham than turkey? Explain.
Answer:
6 classmates chose Turkey.
3 classmates chose Cheese.
3 < 6
2 classmates chose Ham.
2 < 6
No, my classmates don’t choose Cheese or ham over Turkey.

Texas Test Prep

Lesson Check

Choose the correct answer.

Question 3.
Which bird did most children choose?
(A) robin
(B) owl
(C) blue jay
Answer:

Texas Go Math Grade 2 Lesson 19.4 Answer Key 8

Texas-Go-Math-Grade-2-Lesson-19.4-Answer-Key-8(1)
Most children choose an owl.
So, option B is correct.
Explanation:
In the favorite bird bar graph we can observe that 8 children choose owl. So, draw a circle for option B.

Question 4.
Sydney chose the bird that got fewer votes than the blue jay. Which bird did Sydney choose?
(A) Robin
(B) owl
(C) sparrow
Answer:
Texas-Go-Math-Grade-2-Lesson-19.4-Answer-Key-8(2)
Option C is correct.
Explanation:
In the favorite bird bar graph we can observe that 3 children voted for Blue jay and 2 children voted for Sparrow. Sydney chose the sparrow that got fewer votes than blue jay. So, draw a circle for option C.

2nd Grade Go Math Lesson 19.4 Homework Answers Question 5.
Matt chose the bird that got 5 more votes than sparrows. Which bird did Matt choose?
(A) owl
(B) Robin
(C) blue jay
Answer:
Texas-Go-Math-Grade-2-Lesson-19.4-Answer-Key-8(3)
Option B is correct.
Explanation:
In the favorite bird bar graph we can observe that 7 children voted for Robin and 2 children voted for Sparrow. Matt chose the robin that got five more votes than sparrows. So, draw a circle for option B.

Question 6.
Multi-Step How many children voted for their favorite bird?
(A) 20
(B) 15
(C) 17
Answer:
Texas-Go-Math-Grade-2-Lesson-19.4-Answer-Key-8(4)

Option A is correct.
Explanation:
7 children voted for Robin.
3 children voted for Blue Jay.
8 children voted for owl.
2 children voted for Sparrow.
7 + 3 + 8 + 2 = 20
20 children voted for their favorite bird. So, draw a circle for option A.

Texas Go Math Grade 2 Lesson 19.4 Answer Key Make Bar Graphs Read More »

Texas Go Math Grade 2 Lesson 19.3 Answer Key Read Bar Graphs

Refer to our Texas Go Math Grade 2 Answer Key Pdf to score good marks in the exams. Test yourself by practicing the problems from Texas Go Math Grade 2 Lesson 19.3 Answer Key Read Bar Graphs.

Texas Go Math Grade 2 Lesson 19.3 Answer Key Read Bar Graphs

Essential Question
How is a bar graph used to show data?
Draw or write to show what you did.

Texas Go Math Grade 2 Lesson 19.3 Answer Key 1
___ red trucks

For The Teacher

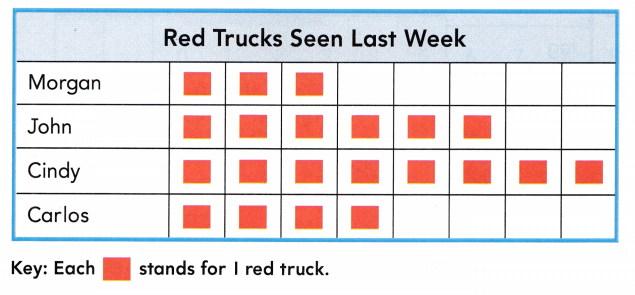
  • Read this problem to children. Morgan made a pictograph to show the number of red trucks that she and her friends saw last week. How many red trucks did the four children see last week?

Answer:
Bar graphs are ideal for comparing two or more values, or values over time. Data is displayed either horizontally or vertically.
3 + 6 + 8 + 4 = 21
The four children seen 21 red trucks last week.
Explanation:
Morgan seen 3 red Trucks, John seen 6 red Trucks, Cindy seen 8 red trucks, and Carlos seen 4 red trucks in last week this data we can observe in the above bar graph. Add all the red trucks. Add 3 with 6, 8 and 4 the sum is 21. Morgan and her friends saw 21 red trucks last week.

Math Talk

Mathematical Processes
Describe how the data in the graph for John and for Cindy different.
Answer:
In the above image we can observe a bar graph named Red trucks seen last week. The data in the graph for John and Cindy are different. John seen 6 red Trucks, and Cindy seen 8 red trucks.

Model and Draw

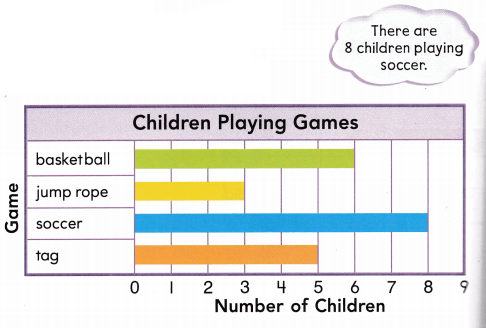
A bar graph uses bars to show data. Look at where the bars end. The numbers of the scale tell how many.
Texas Go Math Grade 2 Lesson 19.3 Answer Key 2
Answer:
In the above bar graph we can observe 6 children playing basket ball, 3 children playing jump rope, 8 children playing soccer, and 5 children playing tag.

Share and Shows

Use the bar graph.

Question 1.
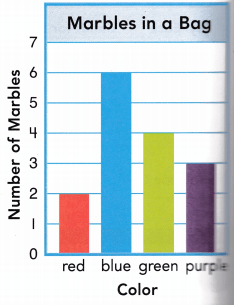
How many green marbles are in the bag?
____ green marbles
Answer:

Texas Go Math Grade 2 Lesson 19.3 Answer Key 3
Answer:
There are 4 green marbles in the bag.
Explanation:
In the above bar graph we can observe color and number marbles in a bag. There are 4 green marbles in the bag.

Go Math Grade 2 Reading A Bar Graph Answer Key Question 2.
How many more blue marbles than purple marbles are in the bag?
______ more blue marbles
Answer:
There are 6 blue marbles and 3 purple marbles in the bag.
6 – 3 = 3
3 more blue marbles.
Explanation:
In the above image we can observe a bar graph named Marbles in a bag. There are 6 blue marbles and 3 purple marbles in the bag. Subtract 3 purple marbles from 6 blue marbles the difference is 3 marbles. There are 3 more blue marbles than purple marbles in the bag.

Question 3.
How many marbles are in the bag?
____ marbles
Answer:
2 + 6 + 4 + 3 = 15
Total number marbles in the bag are 15.
Explanation:
In the above image we can observe a bar graph named Marbles in a bag. There are 2 red marbles, 6 blue marbles, 4 green marbles, and 3 purple marbles in the bag. Add all the marbles in the bag. There are 15 marbles in the bag.

Problem Solving

Use the bar graph.

Texas Go Math Grade 2 Lesson 19.3 Answer Key 4

Question 4.
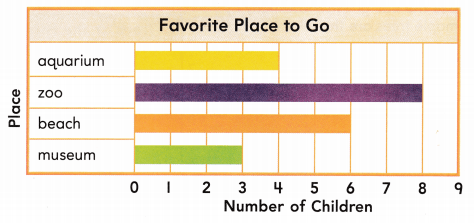
How many children chose the beach?
_____ children
Answer:
6 children chosen the beach.
Explanation:
In the above image we can observe a bar graph named with Favorite place to Go. In that graph 6 children chosen the beach place.

Question 5.
Which place did the fewest children choose?
Answer:
The fewest children choose the Museum place.
Explanation:
In the above image we can observe a bar graph named with Favorite place to Go. In that graph 4 children choose the aquarium place, 8 children choose the zoo place, 6 children choose the beach place, and 3 children choose the museum place. The fewest children choose the Museum place.

Question 6.
H.O.T. Multi-step Greg chose a place that has more votes than the aquarium and the museum together. Which place did Greg choose?
Texas Go Math Grade 2 Lesson 19.3 Answer Key 5
Answer:
Texas-Go-Math-Grade-2-Lesson-19.3-Answer-Key-5
4 + 3 = 7
7 children choose the aquarium and the museum together.
8 children choose the zoo place.
7 < 8
Greg choose zoo place that has more votes than the aquarium and the museum together.
Explanation:
In the above image we can observe a bar graph named with Favorite place to Go. In that graph 4 children choose the aquarium place, 8 children choose the zoo place, and 3 children choose the museum place. First add 4 with 3 the sum is 7. There are 7 children choose the aquarium and the museum together. Greg choose zoo place that has more votes than the aquarium and the museum together.

Texas Go Math Answer Key Bar Graphs 2nd Grade Question 7.
H.O.T. Multi-Step Gina used the data in the bar graph to write 10 < 11. What votes did she compare?
Answer:
The children voted for museum or zoo are 10. The children voted for aquarium or beach are 11. She compared the total number of votes of who voted for either museum or zoo and either aquarium or beach. Gina used the above bar graph data to write 10 < 11.

Daily Assessment Task

Choose the correct answer.

Question 8.
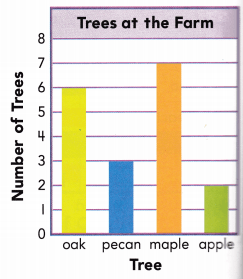
Use the bar graph. How many maple trees are there?
(A) 3
(B) 7
(C) 2
Answer:

Texas Go Math Grade 2 Lesson 19.3 Answer Key 6
Texas-Go-Math-Grade-2-Lesson-19.3-Answer-Key-6(1)
Option B is correct.
Explanation:
In the above image we can observe a bar graph named with Trees at the farm. There are 7 maple trees at the farm. So, draw a circle for option B.

Question 9.
Analyze Use the bar graph. How many fewer apple trees than oak trees are there?
(A) 4
(B) 1
(C) 5
Answer:
Texas-Go-Math-Grade-2-Lesson-19.3-Answer-Key-6(2)
6 – 2 = 4
There are 4 fewer apple trees than oak trees.
So, option A is correct.
Explanation:
In the above image we can observe a bar graph named with Trees at the farm. Subtract 2 apple trees from 6 oak trees the difference is 4. There are 4 fewer apple trees than oak trees. So, draw a circle for option A.

Question 10.
Multi-Step Use the bar graph. How many trees are not apple trees?
(A) 2
(B) 16
(C) 9
Answer:
Texas-Go-Math-Grade-2-Lesson-19.3-Answer-Key-6(3)
6 + 3 + 7 = 16
16 trees are not apple trees.
So, option B is correct.
Explanation:
In the above image we can observe a bar graph named with Trees at the farm. There are 6 oak trees, 3 pecan trees, 7 maple trees and 2 apple trees. Add 6 with 3 and 7 the sum is 16. 16 trees are not apple trees. So, draw a circle for option B.

2nd Grade Bar Graph Go Math Answer Key Question 11.
Texas Test Prep Use the bar graph above. How many oak trees are on the farm?
(A) 6
(B) 3
(C) 8
Answer:
Texas-Go-Math-Grade-2-Lesson-19.3-Answer-Key-6(4)
There are 6 oak trees at the farm.
So, option A is correct.
Explanation:
In the above image we can observe a bar graph named with Trees at the farm. There are 6 oak trees at the farm. So, draw a circle for option A.

Take Home Activity

  • Ask your child to explain how he or she solved one of the exercises in this lesson.

Texas Go Math Grade 2 Lesson 19.3 Homework and Practice Answer Key

Read Bar Graphs

Use the graph.

Texas Go Math Grade 2 Lesson 19.3 Answer Key 7

Question 1.
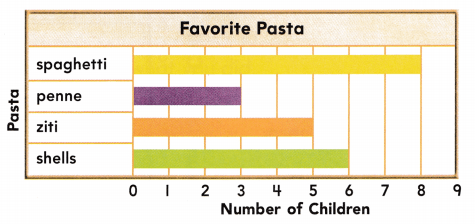
How many children chose shells?
___ children
Answer:
6 children chose shells.
Explanation:
In the above image we can observe a bar graph named with Favorite Pasta. 6 children chose shells.

Question 2.
What pasta did the fewest children choose?
_______
Answer:
Fewest children have chosen Penne.
Explanation:
In the above image we can observe a bar graph named with Favorite Pasta. 8 children choose spaghetti, 3 children chose penne, 5 children choose ziti, 6 children choose shells. Fewest children have chosen penne.

Problem Solving

Use the bar graph above.

Question 3.
Donna chose a pasta that more children chose than shells. What pasta did Donna choose?
________
Answer:
Donna choose spaghetti.
Explanation:
In the above image we can observe a bar graph named with Favorite Pasta. 8 children choose spaghetti, 3 children chose penne, 5 children choose ziti, 6 children choose shells. Donna chose spaghetti pasta because it was chosen by more children than shells.

Question 4.
Multi-Step Bart used the data in the bar graph to write 13 > 9. What votes did he compare?
Answer:
The children voted for spaghetti or ziti are 13. The children voted for penne or shells are 9. She compared the total number of votes of who voted for either spaghetti or ziti and either penne or shells. Bart used the above bar graph data to write 13 > 9.

Texas Test Prep

Lesson Check

Choose the correct answer.

Question 5.
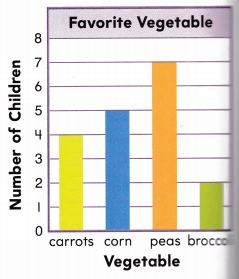
How many children chose broccoli?
(A) 5
(B) 2
(C) 4
Answer:

Texas Go Math Grade 2 Lesson 19.3 Answer Key 8

Question 6.
How many children chose corn or peas?
(A) 12
(B) 9
(C) 18
Answer:
Texas-Go-Math-Grade-2-Lesson-19.3-Answer-Key-8(1)
12 children chose corn or peas.
So, option A is correct.
Explanation:
In the above image we can observe a bar graph named with Favorite vegetables. 12 children chose corn or peas. So, draw a circle for option A.

Bar Diagram 2nd Grade Go Math Answer Key Question 7.
How many fewer children chose carrots than peas?
(A) 4
(B) 2
(C) 3
Answer:
Texas-Go-Math-Grade-2-Lesson-19.3-Answer-Key-8(2)
7 – 4 = 3
3 fewer children chose carrots than peas.
So, option c is correct.
Explanation:
In the above image we can observe a bar graph named with Favorite vegetables. Subtract 4 from 7 the difference is 3. 3 fewer children chose carrots than peas. So, draw a circle for option C.

Question 8.
Multi-Step How many fewer children like carrots or broccoli than corn or peas?
(A) 7
(B) 5
(C) 6
Answer:
Texas-Go-Math-Grade-2-Lesson-19.3-Answer-Key-8(3)
4 + 2 = 6
5 + 7 = 12
12 – 6 = 6
6 fewer children like carrots or broccoli than corn or peas.
So, option C is correct.
Explanation:
In the above image we can observe a bar graph named with Favorite vegetables. 6 children like carrots or broccoli. 12 children like corn or peas. Subtract 6 children from 12 children the difference is 6. 6 fewer children like carrots or broccoli than corn or peas. So, draw a circle for option C.

Texas Go Math Grade 2 Lesson 19.3 Answer Key Read Bar Graphs Read More »

Texas Go Math Grade 2 Lesson 19.2 Answer Key Make Pictographs

Refer to our Texas Go Math Grade 2 Answer Key Pdf to score good marks in the exams. Test yourself by practicing the problems from Texas Go Math Grade 2 Lesson 19.2 Answer Key Make Pictographs.

Texas Go Math Grade 2 Lesson 19.2 Answer Key Make Pictographs

Essential Question
How do you make a pictograph to show data in a tally chart?
Explanation:

Pictures or symbols are made in a pictograph to represent the collected data.
So, we can say that a pictograph represents the data and gives information quickly and clearly.

Explore
Take turns pulling a cube from the bag. Draw a happy face in the graph for each cube.
Texas Go Math Grade 2 Lesson 19.2 Answer Key 1

Math Talk
Mathematical Processes
Explain how you know that the number of happy faces for blue matches the number of blue cubes.

For The Teacher

  • Arrange children in small groups. Children take turns pulling a color cube from a bag. Each child then records a happy face in the pictograph to represent the cube that was pulled.


Model and Draw

Each picture in the pictograph stands for 1 flower. Draw pictures to show the data in the tally chart.

Texas Go Math Grade 2 Lesson 19.2 Answer Key 2
Answer:


Explanation:
Drawn data in the tally chart.

Share and Show

Question 1.
Use the tally chart to complete the pictograph. Draw a Texas Go Math Grade 2 Lesson 19.2 Answer Key 3 for each child.
Texas Go Math Grade 2 Lesson 19.2 Answer Key 4
Answer:

Question 2.
How many children chose tuna? ___ children
Answer: 4
Explanation:
4 children chose tuna

Texas Go Math Grade 2 Lesson 19.2 Answer Key Question 3.
How many more children chose cheese than ham? ___ more children
Answer: 3 more children
Explanation:
children chose cheese = 5
children chose ham = 2
5 – 2 = 3 more children chose cheese than ham

Problem Solving

Question 4.
Use the tally chart to complete the pictograph. Draw a Texas Go Math Grade 2 Lesson 19.2 Answer Key 5 for each child.
Texas Go Math Grade 2 Lesson 19.2 Answer Key 6
Use the pictograph.
Answer:

Question 5.
How many children chose banana? ________ children
Answer: 5 children
Explanation:
5 children chose banana

Question 6.
How many fewer children chose plum than banana? ___ fewer children
Answer: 3 fewer children
children chose plum 2
children chose Banana 5
5  – 2 = 3 fewer children chose plum than banana

Question 7.
H.O.T. Multi-Step How many children chose a fruit that was not a plum?

Texas Go Math Grade 2 Lesson 19.2 Answer Key 7
___ children
Answer: 12 children
Explanation:
12 children chose a fruit that was not a plum

Texas Go Math Answer Key Grade 2 Lesson 19.2 Question 8.
H.O.T. Multi-Step Which three fruits were chosen by a total of 10 children?
Answer: orange, banana, and plum
Explanation:
orange, = 3
banana = 5
and plum = 2
3 + 5 + 2 = 10
three fruits were chosen by a total of 10 children

Daily Assessment Tasks

Choose the correct answer.

Texas Go Math Grade 2 Lesson 19.2 Answer Key 8

Question 9.
Reasoning Use the pictograph above. Dave chose a season that got fewer votes than spring.What is Dave’s favorite season?
(A) spring
(B) summer
(C) fall
Answer: C
Explanation:
Fall was the season that got fewer votes than spring
Fall is Dave’s favorite season

Question 10.
Apply Use the pictograph above. Mary chose winter a her favorite season. How many children chose a season that was not winter?
(A) 7
(B) 18
(C) 14
Answer: B
Explanation:
18 children chose a season that was not winter

Question 11.
‘Texas Test Prep Use the pictograph. How many children chose orange juice?
(A) 2
(B) 9
(C) 3
Texas Go Math Grade 2 Lesson 19.2 Answer Key 9
Answer: C
Explanation:
3 children chose orange juice.

Texas Go Math Grade 2 Lesson 19.2 Homework and Practice Answer Key

Make Pictographs

Question 1.
Use the tally chart to complete the pictograph. Draw a Texas Go Math Grade 2 Lesson 19.2 Answer Key 10 for each child.
Texas Go Math Grade 2 Lesson 19.2 Answer Key 11
Answer:
Texas-Go-Math-Grade-2-Lesson-19.2-Answer-Key-11
Explanation:
The pictograph is completed by using the tally chart.

Question 2.
How many children chose red?
____ children
Answer:
5 children chose red.
Explanation:
In the above image we can observe a tally chart named with Favorite color. In that chart we can observe red color is chose by 5 children.

Question 3.
How many fewer children chose yellow than green?
____ fewer children
Answer:
5 – 2 = 3
3 fewer children chose yellow than green.
Explanation:
In the above image we can observe a tally chart named with Favorite color. 2 children chose yellow color and 5 children chose green color. Subtract 2 children from 5 children the difference is 3 children. So, 3 fewer children chose yellow than green.

Problem Solving

Question 4.
Multi-Step How many children chose a color that was not yellow?
____ children
Answer:
4 + 5 + 5 = 14
14 children chose a color that was not yellow.
Explanation:
In the above image we can observe a tally chart named with Favorite color. In that chart we can observe 4 children chose blue color, 5 children chose green color, 5 children choose red color, and 2 children chose yellow color. Add all the colors except yellow color. Add 4 with 5 and 5 the sum is 14 So, 14 children chose a color that was not yellow.

Texas Go Math Grade 2 Pdf Lesson 19.2 Pictograph Question 5.
Multi-Step Which three colors were chosen by a total of 14 children?
Answer:
The three colors were blue, green, and red. These colors are chosen by a total of 14 children.
Explanation:
In the above image, we can observe a tally chart named with Favorite color. The colors that are chosen by a total of 14 children are blue, green, and red.

Texas Test Prep

Lesson Check

Choose the correct answer.

Question 6.
Use the pictograph. How many children chose goat as their favorite born animal?
(A) 8
(B) 3
(C) 4
Texas Go Math Grade 2 Lesson 19.2 Answer Key 12
Answer:
Texas-Go-Math-Grade-2-Lesson-19.2-Answer-Key-12(1)
3 children chosen a goat as their favorite born animal.
So, option B is correct.
Explanation:
In the above image we can observe a pictograph named with Favorite born animal. In that pictograph 3 children chosen a goat as their favorite born animal. So, draw a circle for option B.

Texas Go Math Grade 2 Lesson 19.2 Answer Key 13

Use the pictograph above.

Question 7.
Steve chose a flavor that got fewer votes than strawberry. What is Steve’s favorite ice cream flavor?
(A) maple
(B) chocolate
(C) vanilla
Answer:
Texas-Go-Math-Grade-2-Lesson-19.2-Answer-Key-13(1)
4 children voted for strawberry, and 1 children voted for maple.
Steve’s favorite ice cream flavor is maple.
So, option A is correct.
Explanation:
In the above image we can observe a pictograph named with Favorite ice cream flavor. Steve chosen a maple flavor because it got a fewer votes than strawberry. Steve’s favorite ice cream flavor is maple. So, draw a circle for option A.

Question 8.
Tracey chose vanilla as her favorite ice cream flavor. How many children chose a flavor that was not vanilla?
(A) 12
(B) 10
(C) 17
Answer:
Texas-Go-Math-Grade-2-Lesson-19.2-Answer-Key-13(2)
5 + 1 + 4 = 10
10 children chosen a flavor that was not vanilla.
So, option B is correct.
Explanation:
In the above image we can observe a pictograph named with Favorite ice cream flavor. In that graph we can observe 5 children choose chocolate, 1 children choose maple, and 4 children choose strawberry. Add 5 with 1 and 4 the sum is 10. So, 10 children chosen a flavor that was not vanilla. So, draw a circle for option B.

Texas Go Math Grade 2 Lesson 19.2 Answer Key Make Pictographs Read More »

Texas Go Math Grade 2 Lesson 19.1 Answer Key Read Pictographs

Refer to our Texas Go Math Grade 2 Answer Key Pdf to score good marks in the exams. Test yourself by practicing the problems from Texas Go Math Grade 2 Lesson 19.1 Answer Key Read Pictographs.

Texas Go Math Grade 2 Lesson 19.1 Answer Key Read Pictographs

Essential Question
How do you use a pictograph to show data?
Explanation:
Pictograms use a series of repeated icons to visualize simple data.
The icons are arranged in a single line or a grid,
with each icon representing a certain number of units

Explore
Use the tally chart to solve the problem. Draw or write to show what you did.

Texas Go Math Grade 2 Lesson 19.1 Answer Key 1
__ more children
Explanation:
7 – 4 = 3
3 more children

Math Talk
Mathematical processes
Can the chart be used to find how many girls chose music? Explain.
Explanation:
Yes, The chart is used to find how many girls chose music
1 line represent one girl
so, 5 girls chose music

For The Teacher

  • Read the following problem. Mr. Martin’s class made this tally chart. How many more children in his class chose sports ? Explain. than chose reading as their favorite hobby?
    Explanation:
    4 chose reading
    7 chose sports
    7 – 4 = 3 more children in his class chose sports than chose reading as their favorite hobby

Model and Draw
A pictograph uses pictures to show data.
Texas Go Math Grade 2 Lesson 19.1 Answer Key 2

A key tells how many each picture stands for.
Texas Go Math Grade 2 Lesson 19.1 Answer Key 3

Share and Show

Use the pictograph to answer the questions.
Texas Go Math Grade 2 Lesson 19.1 Answer Key 4

Question 1.
Which snack was chosen by the fewest children?
Answer: popcorn
Explanation:
popcorn snack was chosen by the fewest children

Pictographs 2nd Grade Texas Go Math Answer Key Question 2.
How many more children chose pretzels than apples? _________ more children
Answer:  2 more children
Explanation:
Number of children chose pretzels = 8
Number of children chose apples = 6
8 – 6 = 2

Problem Solving

Use the pictograph to answer the questions.
Texas Go Math Grade 2 Lesson 19.1 Answer Key 5

Question 3.
How many pencils do Alana and Brad have?
__ pencils
Answer: 11 pencils
Explanation:
Number of pencils Alana had = 3
Number of pencils Brad had = 8
8 + 3 = 11

Question 4.
How many more pencils does Teresa have than Alana has?
______ more pencils
Answer:  2 more pencils
Explanation:
Number of pencils Alana had = 3
Number of pencils  Teresa have = 5
5 – 3 = 2

Question 5.
Multi-Step Mrs. Green has the same number of pencils as the four children. How many pencils does she have?
Texas Go Math Grade 2 Lesson 19.1 Answer Key 6
________ pencils
Answer:
Number of pencils Alana = 3
and Number of pencils Brad = 8
Number of pencils Teresa = 5
Number of pencils John = 4
All 4 = 20
so, Mrs. Green has 20 pencils.

Texas Go Math Pictograph 2nd Grade Question 6.
H.O.T. Christy has 7 pencils. Write two sentences to describe how her number of pencils compares to the data in the pictograph.
Answer:
Christy has 7 pencils.
Explanation:
The total students have 20 pencils
Bred has 8 and Christy has 7
Christy had 1 less than Bred

Daily Assessment Task

Choose the correct answer.

Texas Go Math Grade 2 Lesson 19.1 Answer Key 7

Question 7.
Use Graphs Look at the pictograph above. How many children chose red balloons?
(A) 7
(B) 5
(C) 6
Answer: A
Explanation:
7 children chose red balloons.

Question 8.
Representations Use the pictograph above. How many children voted in all?
(A) 11
(B) 16
(C) 12
Answer: B
Explanation:
16 children voted in all

Texas Go Math Lesson 19.1 The Major Scale Answer Key Question 9.
Texas Test Prep Use the pictograph. How many pets do the three children have?

(A) 6
(B) 3
(C) 5
Answer: A
Explanation:
All the three children have 6 pets

Texas Go Math Grade 2 Lesson 19.1 Homework and Practice Answer Key

Use the pictograph to answer the questions.
Texas Go Math Grade 2 Lesson 19.1 Answer Key 8

Question 1.
Which juice was chosen by the fewest children?
________
Answer:
Berry Juice was chosen by the fewest people.
Explanation:
In the above image we can observe a pictograph named with Favorite Juice. In that graph we can observe berry juice was chosen by the fewest people.

Question 2.
How many children chose apple juice or orange juice?
____ children
Answer:
7 children chose apple juice.
6 children chose orange juice.
7 + 6 = 13
13 children chose apple juice or orange juice.
Explanation:
In the above image we can observe a pictograph named with Favorite Juice. In that pictograph 7 children chose apple juice and 6 children chose orange juice. Add 7 children with 6 children the sum is 13 children. So, 13 children chose apple juice or orange juice.

Question 3.
How many more children chose apple juice than grape juice?
_____ more children
Answer:
7 children chose apple juice.
5 children chose grape juice.
7 – 5 = 2
2 more children chose apple juice than grape juice.
Explanation:
In the above image we can observe a pictograph named with Favorite Juice. In that pictograph 7 children chose apple juice and 5 children chose grape juice. Subtract 5 children from 7 children the difference is 2 children. So, 2 more children chose apple juice than grape juice.

Problem Solving

Question 4.
Multi-Step Hal likes the juice chosen by 5 children. Martha likes the most favorite juice. Which juices did Hal and Martha choose?
Hal: _____
Martha: _____
Answer:
Hal choose grape juice.
Martha choose apple juice.
Explanation:
In the above image we can observe a pictograph named with Favorite Juice. Grape juice is chosen by 5 children. So, Hal choose grape juice. Apple juice is chosen by 7 children. The most favorite juice for children is apple juice. So, Martha choose apple juice.

Lesson Check

Texas Test Prep

Choose the correct answer.

Question 5.
Use the pictograph. How many puppies do Mark and Dan have?
Texas Go Math Grade 2 Lesson 19.1 Answer Key 9
(A) 7
(B) 3
(C) 6
Answer:
Texas-Go-Math-Grade-2-Lesson-19.1-Answer-Key-9(1)
Mark have 2 puppies
Dan has 1 puppy.
2 + 1 = 3
So, option B is correct.
Explanation:
In the above image, we can observe a pictograph named with Number of Puppies. Mark has 2 puppies and Dan has 1 puppy. Add 2 with 1 the sum is 3. Mark and Dan have 3 puppies. So, draw a circle for option B.

Go Math Lesson 19.1 Homework Answers 2nd Grade Question 6.
Use the pictograph. How many children chose black?
Texas Go Math Grade 2 Lesson 19.1 Answer Key 10
(A) 4
(B) 6
(C) 3
Answer:
Texas-Go-Math-Grade-2-Lesson-19.1-Answer-Key-10(1)
4 children chose black.
So, option A is correct.
Explanation:
In the above image, we can observe a pictograph named Favorite Bike Color. Black color is chosen by 4 children. So, draw a circle for option A.

Question 7.
Use the pictograph above. How many children chose black or silver?
(A) 6
(B) 4
(C) 7
Answer:
Texas-Go-Math-Grade-2-Lesson-19.1-Answer-Key-10(2)
4 children chose black color.
3 children chose the silver color
4 + 3 = 7
7 children chose black or silver color.
So, option C is correct.
Explanation:
In the above image, we can observe a pictograph named with Favorite Bike color. Black color is chosen by 4 children and silver color is chosen by 3 children. Add 4 children with 3 children the sum is 7 children. The black or silver color is chosen by 7 children. So, draw a circle for option C.

Texas Go Math Grade 2 Lesson 19.1 Answer Key Read Pictographs Read More »

Texas Go Math Grade 2 Lesson 18.3 Answer Key Time to the Minute

Refer to our Texas Go Math Grade 2 Answer Key Pdf to score good marks in the exams. Test yourself by practicing the problems from Texas Go Math Grade 2 Lesson 18.3 Answer Key Time to the Minute.

Texas Go Math Grade 2 Lesson 18.3 Answer Key Time to the Minute

Problem Solving

Look at the time. Draw the clock hands to show the same time.

Question 7.
Texas Go Math Grade 2 Lesson 18.3 Answer Key 19
Answer:
Texas-Go-Math-Grade-2-Lesson-18.3-Answer-Key-19
The time is 8 : 25.
Explanation:
The time is showing 8 hours and 25 minutes. So, hour hand should be after 8 and near to 9. Minute hand should be pointing to number 5 in the clock.

Question 8.
Texas Go Math Grade 2 Lesson 18.3 Answer Key 20
Answer:
Texas-Go-Math-Grade-2-Lesson-18.3
The time is 2 : 48.
Explanation:
The time is showing 2 hours and 48 minutes. So, hour hand should be after 2 and near to 3. Minute hand should be between 9 and 10 in the clock.

Question 9.
Texas Go Math Grade 2 Lesson 18.3 Answer Key 21
Answer:
Texas-Go-Math-Grade-2-Lesson-18.3-Answer-Key-21
The time 5 : 03.
Explanation:
The time is showing 5 hours and 3 minutes. So, hour hand should be at 5. Minute hand should be in between 12 and 1 in the clock.

Question 10.
Multi-Step Look at the clocks to see when Rachel started each activity.
Texas Go Math Grade 2 Lesson 18.3 Answer Key 22
Texas Go Math Grade 2 Lesson 18.3 Answer Key 23
Answer:
Write the times of the activities in order.
Texas Go Math Grade 2 Lesson 18.3 Answer Key 24
Texas-Go-Math-Grade-2-Lesson-18.3-Answer-Key-24
Explanation:
Rachel started first played a ball at 3 : 05. Second he read a book at 3 : 21. Third he ate a snack at 3 : 45.

Question 11.
Jamie ate a snack 15 minutes before 4:00.
At what time did Jamie eat a snack?
Texas Go Math Grade 2 Lesson 18.3 Answer Key 25
Answer:
Texas-Go-Math-Grade-2-Lesson-18.3-Answer-Key-25
Explanation:
Jamie ate a snack 15 minutes before 4:00. Which means Jamie ate a snack at 3 : 45.

Daily Assessment Task

Choose the correct answer.

Question 12.
Apply This clock shows the time that Miss Grant went to work at the library. Which digital clock shows the same time as the clock to the right?
Texas Go Math Grade 2 Lesson 18.3 Answer Key 26
Answer:
Texas-Go-Math-Grade-2-Lesson-18.3-Answer-Key-26
Explanation:
The clock shows the time that Miss Grant went to work at the library. The second digital clock shows the same time as the clock to the right. So, put a tick mark to the digital clock with a time 2 : 18.

Question 13.
Representations Kyla started to read at the time shown on this digital clock. Which clock shows the same time?
Texas Go Math Grade 2 Lesson 18.3 Answer Key 27
Answer:
Texas-Go-Math-Grade-2-Lesson-18.3-Answer-Key-27
Explanation:
Kyla started to read at the time shown on the digital clock. The first clock shows the same time as the digital clock to the right. So, put a tick mark to the digital clock with a time 12 : 34.

Question 14.
Texas Test Prep What time is shown on this clock?
(A) 12:30
(B) 6:03
(C) 6:30
Texas Go Math Grade 2 Lesson 18.3 Answer Key 28
Answer:
Texas-Go-Math-Grade-2-Lesson-18.3-Answer-Key-28(1)
Option B is correct.
Explanation:
The time shown on the above clock is 6 : 03. So, draw a circle for option B.

Take Home Activity

  • Name a time to the minute. Ask your child to describe where the clock hands point for this time.

Texas Go Math Grade 2 Lesson 18.3 Homework and Practice Answer Key

Look at the clock hands. Write the time.

Question 1.
Texas Go Math Grade 2 Lesson 18.3 Answer Key 30
Answer:
Texas-Go-Math-Grade-2-Lesson-18.3-Answer-Key-30
The time is 6 : 32.
Explanation:
In the above clock the hour hand is after 6 and near to 7. The minute hand is in between 6 and 7 in the clock. So, the time is 6 : 32 which means 6 hours and 32 minutes.

Question 2.
Texas Go Math Grade 2 Lesson 18.3 Answer Key 31
Answer:
Texas-Go-Math-Grade-2-Lesson-18.3-Answer-Key-31
The time is 3 : 18.
Explanation:
In the above clock the hour hand is after 3 and near to 4. The minute hand is in between 3 and 4 in the clock. So, the time is 3 : 18 which means 3 hours and 18 minutes.

Question 3.
Texas Go Math Grade 2 Lesson 18.3 Answer Key 32
Answer:
Texas-Go-Math-Grade-2-Lesson-18.3-Answer-Key-32
The time is 7 : 30.
Explanation:
In the above clock the hour hand is after 7 and near to 8. The minute hand is on the number 6 in the clock. So, the time is 7 : 30 which means 7 hours and 30 minutes.

Problem Solving

Question 4.
Multi-Step Look at the clocks to see when Bonnie started each activity.
Texas Go Math Grade 2 Lesson 18.3 Answer Key 33
Answer:

Write the times of the activities in order. Start with the activity Bonnie did first.

Texas Go Math Grade 2 Lesson 18.3 Answer Key 35

Texas-Go-Math-Grade-2-Lesson-18.3-Answer-Key-35
Explanation:
Bonnie first wakes up at 8 : 09. Second he gets dressed up at 8 : 25. Third he eats breakfast at 8 : 52.

Texas Test Prep

Choose the correct answer.

Question 5.
What time is shown on this clock?
(A) 12:15
(B) 3:01
(C) 3:30
Texas Go Math Grade 2 Lesson 18.3 Answer Key 36
Answer:
Texas-Go-Math-Grade-2-Lesson-18.3-Answer-Key-36(1)
Option B is correct.
Explanation:
The time shown on the above clock is 3 : 01. So, draw a circle for option B.

Question 6.
This clock shows the time that Evan watches TV. What time is shown on the clock?
Texas Go Math Grade 2 Lesson 18.3 Answer Key 37
(A) 11:28
(B) 4:55
(C) 12:30
Answer:
Texas-Go-Math-Grade-2-Lesson-18.3-Answer-Key-37(1)
The time shown on the above clock is 11 : 28.
So, option A is correct.
Explanation:
Evan watches TV at 11: 28. So, draw a circle for option A.

Question 7.
This clock shows the time that Abby calls her friend. What time is shown on the clock?
(A) 3:45
(B) 8:15
(C) 3:42
Texas Go Math Grade 2 Lesson 18.3 Answer Key 38
Answer:
Texas-Go-Math-Grade-2-Lesson-18.3-Answer-Key-38(1)
The time shown on the above clock is 3 : 42.
Option C is correct.
Explanation:
Abby calls her friend at 3 : 42. So, draw a circle for option C.

Question 8.
What time is shown on this clock?
Texas Go Math Grade 2 Lesson 18.3 Answer Key 39
(A) 8:35
(B) 7:32
(C) 7:47
Answer:
Texas-Go-Math-Grade-2-Lesson-18.3-Answer-Key-39(1)
option B is correct.
Explanation:
The time shown on the above clock is 7 : 32. So, draw a circle for option B.

Texas Go Math Grade 2 Lesson 18.3 Answer Key Time to the Minute Read More »

Scroll to Top