Texas Go Math Grade 8 Lesson 6.3 Answer Key Comparing Functions
Refer to our Texas Go Math Grade 8 Answer Key Pdf to score good marks in the exams. Test yourself by practicing the problems from Texas Go Math Grade 8 Lesson 6.3 Answer Key Comparing Functions.
Texas Go Math Grade 8 Lesson 6.3 Answer Key Comparing Functions
Essential Question
How can you use tables, graphs, and equations to compare functions?
Your Turn
Question 1.
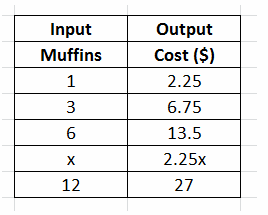
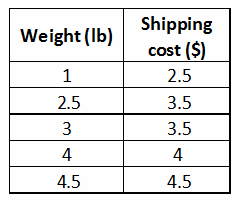
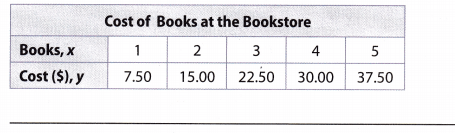
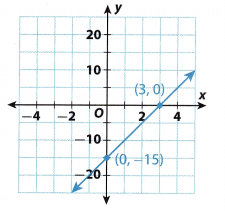
Quentin is choosing between buying books at the bookstore or buying online versions of the books for his tablet. The cost, y dollars, of ordering books online for x books is y = 6.95x + 1.50. The cost of buying the books at the bookstore is shown in the table. Which method of buying books is more expensive if Quentin wants to buy 6 books?
Answer:
y = 6.95x + 1.5 Buying the books online
y = 6.95(6) + 1.5 = $43.2 When Quentin wants to buy 6 books, substitute x = 6
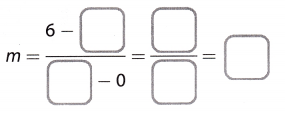
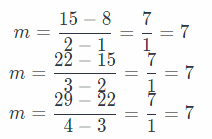
Slope = \(\frac{15-7.5}{2-1}\) = \(\frac{7.5}{1}\) = 7.5 Writing the equation for buying the books at the bookstore. Find the slope using given points by Slope (m) = \(\frac{y_{2}-y_{1}}{x_{2}-x_{1}}\) where (x2, y2) = (2, 15) and (x1, y1) = (1, 7.5)
15 = 7.5(2) + b Substituting the value of slope (m) and (x, y) in the
15 = 15 + b slope intercept form to find y intercept (b): y = mx + b
b = 15 – 15 = 0
y = 7.5x Substituting the value of slope (m) and y intercept (b) in slope intercept form: y = mx + b
y = 7.5(6) = $45 When Quentin wants to buy 6 books, substitute x = 6
Buying books at the bookstore is more expensive. Compare the cost of buying 6 books $43.2 < $45
Texas Go Math Grade 8 Lesson 6.3 Explore Activity Answer Key
Explore Activity 1
Comparing a Table and a Graph
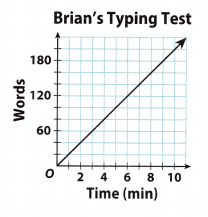
The table and graph show how many words Morgan and Brian typed correctly on a typing test. For both students, the relationship between words typed correctly and time is linear.
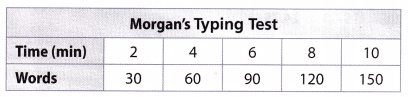
A. Find Morgan’s unit rate.
B. Find Brian’s unit rate.
C. Which student types more correct words per minute?
Reflect
Lesson 6.3 Comparing Functions Answer Key Go Math 8th Grade Question 2.
Katie types 17 correct words per minute. Explain how a graph of Katie’s test results would compare to Morgan’s and Brian’s.
Answer:
Katie types 17 correct words per minute; Brian types 20 correct words per minute and Morgan types 15 correct words per minute. Therefore, the graph of Katie’s test results will be a straight line that passes through the origin (0, 0). The value of its slope is greater than the slope of Morgan’s graph of test results and smaller than the slope of Brian’s graph of test results. So, the graph will be a straight line that lies between the line of Morgan and Brian.
Explore Activity 2
Comparing a Graph and a Description
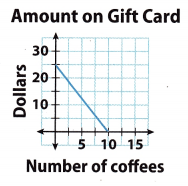
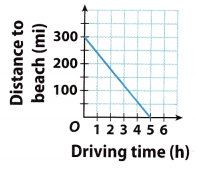
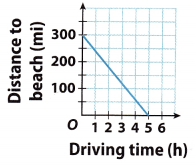
Jamal wants to buy a new game system that costs $200. He does not have enough money to buy it today, so he compares layaway plans at different stores.
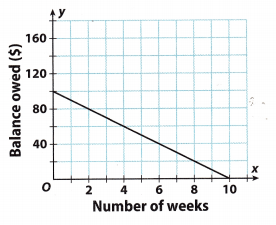
The plan at Store A is shown on the graph.
Store B requires an initial payment of $60 and weekly payments of $20 until the balance is paid in full.
A. Write an equation in slope-intercept form for Store A’s layaway plan. Let x represent the number of weeks and y represent the balance owed.
B. Write an equation in slope-intercept form for Store B’s layaway plan. Let x represent the number of weeks and y represent the balance owed.
C. Sketch a graph of the plan at Store B on the same grid as Store A.
D. How can you use the graphs to tell which plan requires the greater down payment? How can you use the equations?
E. How can you Use the graphs to tell which plan requires the greater weekly payment? How can you use the equations?
F. Which plan allows Jamal to pay for the game system faster? Explain.
Texas Go Math Grade 8 Lesson 6.3 Guided Practice Answer Key
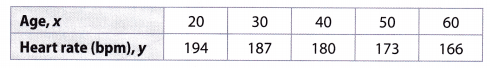
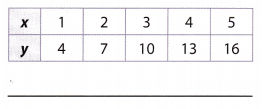
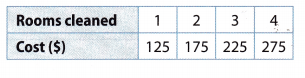
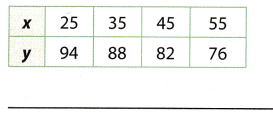
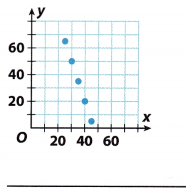
Doctors have two methods of calculating maximum heart rate. With the first method, the maximum heart rate,y, in beats per minute is y = 220 – x, where x is the person’s age. The maximum heart rate with the second method is shown in the table. (Example 1)

Question 1.
Which method gives the greater maximum heart rate for a 70-year-old?
Answer:
y = 220 – x First method
y = 220 – 70 = 150 Substitute x = 70 yrs
slope = \(\frac{187-194}{30-20}\) = \(\frac{-7}{10}\) = -0.7
Writing the equation for the second method. Find the slope using given points by slope (m) = \(\frac{y_{2}-y_{1}}{x_{2}-x_{1}}\) where (x2, y2) = (30, 187) and (x1, y1) = (20, 194)
194 = -0.7(20) + b Substituting the value of slope (m) and (x, y) in the slope-intercept form to find y-intercept (b): y = mx + b
194 = -14 + b
b = 194 + 14 = 208
y = 208 – 0.7x Substituting the value of slope (m) and y-intercept (b) in slope-intercept form: y = mx + b
y = 208 – 0.7(70) = 159 Substitute x = 70 yrs
The second method gives the greater maximum heart rate for a 70-year-old methods
Compare the maximum heart rate for the two methods
150 < 159
Question 2.
Are heart rate and age proportional or nonproportional for each method?
Answer:
For method 1, the relationship is non-proportional. Comparing with the general linear form of an equation: y = mx + b.
For method 2, the relationship is non-proportional. Since b ≠ 0, the relationship is not proportional.
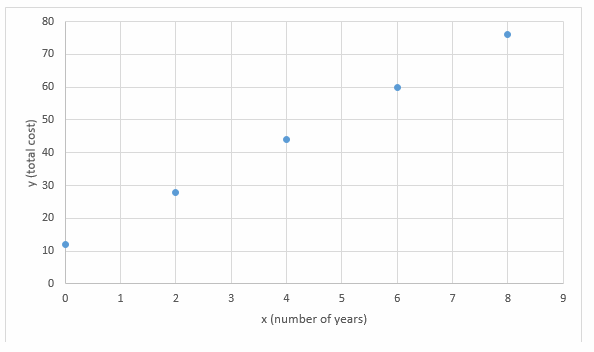
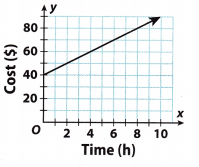
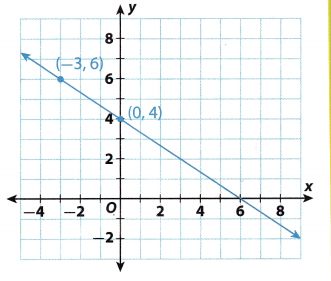
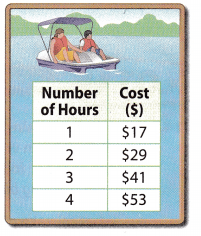
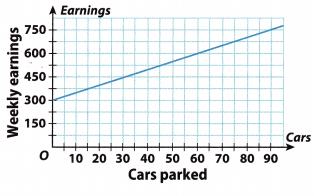
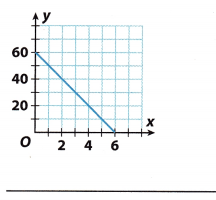
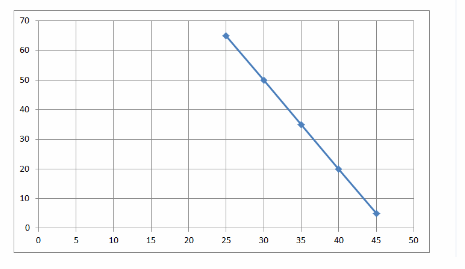
Aisha runs a tutoring business. With Plan 1, students may choose to pay $15 per hour. With Plan 2, they may follow the plan shown on the graph. (Explore Activity 1 and 2)
Question 3.
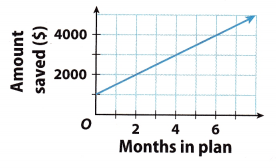
Describe the plan shown on the graph.
Answer:
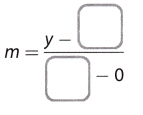
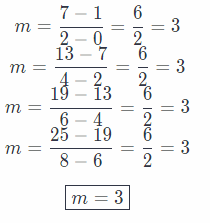
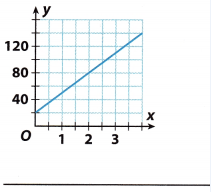
We choose two points on the graph to find the slope. We substitute (0, 40) for (x1, y1) and (4, 60) for (x2, y2).
m = \(\frac{y_{2}-y_{1}}{x_{2}-x_{1}}\) = \(\frac{60-40}{4-0}\) = \(\frac{20}{4}\) = 5
We read the y-intercept from the graph, which is 40.
b = 40
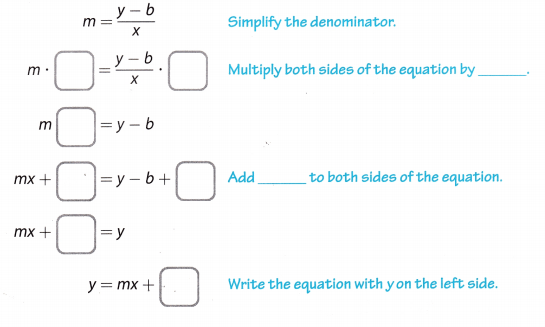
We use the slope and y-intercept values that we found to write an equation in slope-intercept form.
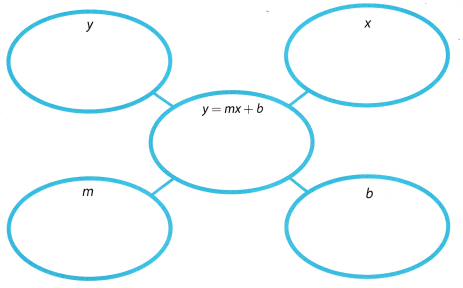
y = mx + b
y = 5x + 40
This means that
Plan 2 has an initial cost of $40 and a rate of $5 per hour
Question 4.
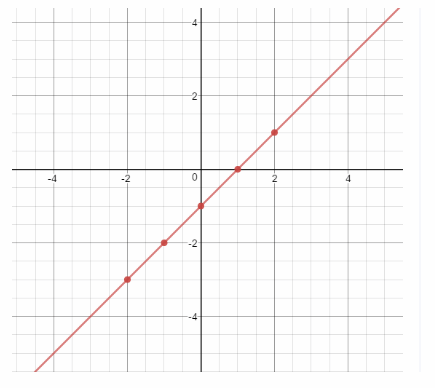
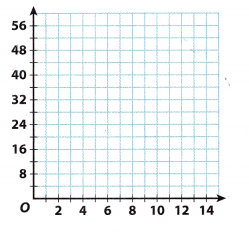
Sketch a graph of Plan 1 on the same grid as Plan 2.
Answer:

Plan 1 is represented by red and Plan 2 is represented by blue
8th Grade Comparing Functions Answer Key Lesson 6.3 Question 5.
What does the intersection of the two graphs mean?
Answer:
The intersection of the two graphs represents the number of hours for which both plans will cost the same.
Question 6.
Which plan is cheaper for 10 hours of tutoring?
Answer:
Knowing that with Plan 1 student pays 15 dollars per hour, we can calculate the cost of 10 hours of tutoring. Variable y is the cost and variable æ is the number of hours. Therefore:
y1 = 15x
y1 = 15 . 10
y1 =150
To calculate the cost of Plan 2, we will use the following formula:
y2 = 5x + 40,
where variable y is the cost and variable x is the number of hours. Therefore:
y2 = 5 . 10 + 40
y2 = 90
Hence, we can conclude that Plan 2 is cheaper for 10 hours of tutoring.
Question 7.
Are cost and time proportional or nonproportional for each plan?
Answer:
The cost and time are proportional for Plan 1 Compared with the general linear form of equation: y = mx + b. Since b = 0, the relationship is proportional.
The cost and time are not proportional for Plan 2 Compared with the general linear form of equation: y = mx + b.
Since b ≠ 0, the relationship is not proportional.
Essential Question Check-In
Go Math Grade 8 Lesson 6.3 Answer Key Question 8.
When using tables, graphs, and equations to compare functions, why do you find the equations for tables and graphs?
Answer:
The tables and graphs represent a part of the solution of the function By writing the equation, any value can be substituted to evaluate the function and compare it with the equations.
Texas Go Math Grade 8 Lesson 6.3 Independent Practice Answer Key
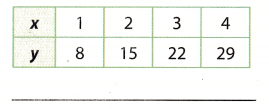
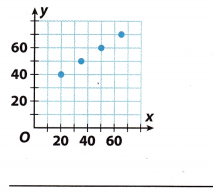
The table and graph show the miles driven and gas used for two scooters.

Question 9.
Which scooter uses fewer gallons of gas when 1350 miles are driven?
Answer:
Looking at the given table for scooter A, we can conclude that scooter uses 2 gallons for every 150 miles. Therefore, we can write the equation where variable y represents used gallons of gas and variable x represents driven miles.
ya = \(\frac{2 x}{150}\)
ya = \(\frac{x}{75}\)
Considering the fact that we are testing the consumption of gas for 1350 driven miles, we can use the equation for ya and insert x = 1350 as follows:
ya = \(\frac{1350}{75}\)
ya = 18
Given graph represents driven miles and gas used for scooter B. We will find value of driven miles for gas
consumption of 1 gallon by drawing a horizontal line on the value of 1 gallon and looking for an intersection with the
function. Lines intersect on x = 90, meaning that scooter B uses 1 gallon of gas for 90 driven miles. Therefore:
yb = \(\frac{x}{90}\),
where yb is the consumption of gas and variable x represents driven miles.
Using the equation obtained in the previous step, we can calculate gas consumption for 1350 driven miles.
yb = \(\frac{1350}{90}\)
yb = 15
Hence, we can conclude that scooter B uses fewer gallons of gas when driving 1350 miles.
Lesson 6.3 Answer Key 8th Grade Comparing Functions Question 10.
Are gas used and miles proportional or nonproportional for each scooter?
Answer:
The gas used and miles are proportional for both scooters.
Comparing with the general linear form of an equation: y = mx + b. Since b = 0, the relationship is proportional.
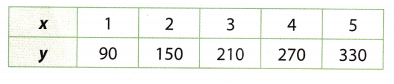
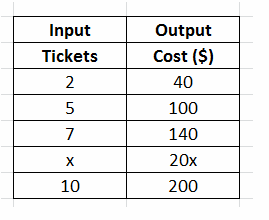
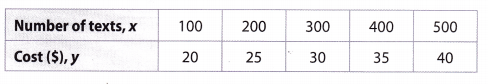
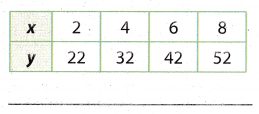
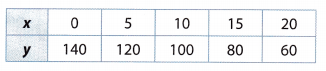
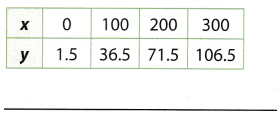
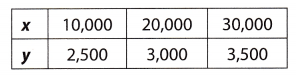
A cell phone company offers two texting plans to its customers. The monthly cost, y dollars, of one plan, is y = 0.10x + 5, where x is the number of texts. The cost of the other plan is shown in the table.
Question 11.
Which plan is cheaper for under 200 texts? ______
Answer:
y = 0.10x + 5 Plan 1
y = 0.10(199) + 5 = $24.90 Substitute x = 199
slope = \(\frac{25-20}{200-100}\) = \(\frac{5}{100}\) = 0.05 Writing the equation for plan 2. Find the slope using given points by Slope (m) = \(\frac{y_{2}-y_{1}}{x_{2}-x_{1}}\)
where (x2, y2) = (200, 25) (x1, y1) = (100, 20)
20 = 0.05(100) + b Substituting the value of slope (m) and (x, y) in the slope-intercept form to find y-intercept (b):
20 = 5 + b y = mx + b
b = 20 – 5 = 15
y = 0.05x + 15 Substituting the value of slope (m) and y-intercept (b) in slope-intercept form: y = mx + b
y = 0.05(199) + 15 = $24.95 Substitute x = 199
Plan 1 is cheaper Compare the cost for two plans for text < 200
$24.90 < $24.95
Question 12.
The graph of the first plan does not pass through the origin. What does this indicate?
Answer:
y = 0.10x + 5 Plan 1
The graph that does not pass through the origin indicates that there is a base price of $\$5$ for the plan.
Go Math 8th Grade Lesson 6.3 Comparing Functions Question 13.
Brianna wants to buy a digital camera for a photography class. One store offers the camera for $50 down and a payment plan of $20 per month. The payment plan for a second store is described by y = 15x + 80, where y is the total cost in dollars and x is the number of months. Which camera is cheaper when the camera is paid off in 12 months? Explain.
Answer:
For us to determine which camera is cheaper when the camera is paid off in 12 months, let us determine the total cost of the digital camera offered by the two stores.
The first store offers the camera for $50 down and a payment of $20 per month. By applying the slope-intercept form y = mx + b. Let y be the total cost of the camera for the first store x be the number of months the camera needs to be paid off m be the payment every month b be the down payment
Substituting the values of m = 20, b = 50, and x = 12, the total cost of the camera offered by the first store is
\begin{aligned}
y&=mx+b\
y&=20(12)+50\
y&=240+50\
y&=290
\end{aligned}
Thus, the total cost of the camera offered by the first store is $290
The payment plan for the second store is described by y = 15x + 80
where y is the total. cost of the camera in dollars and x is the number of months
Thus, the total cost of the camera offered by the second store is $260
Now, let us compare the total costs of the camera offered by the two stores. The total cost of the camera offered by the first store is $290 while the second store camera’s total cost is $260. Since $260 is less than $290, then we can conclude that **the camera of the second store is cheaper than the camera of the first store**.
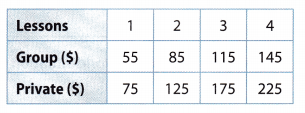
Question 14.
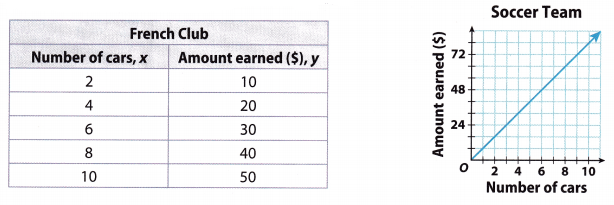
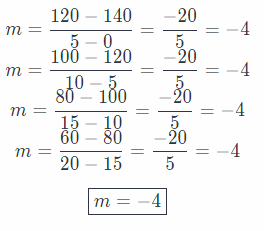
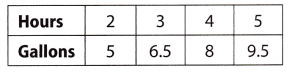
The French club and soccer team are washing cars to earn money. The amount earned, y dollars, for washing x cars is a linear function. Which group makes the most money per car? Explain.
Answer:
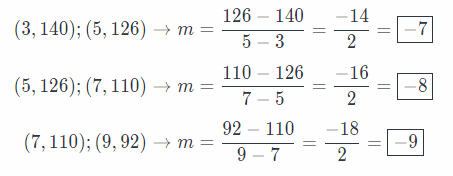
slope = \(\frac{20-10}{4-2}\) = \(\frac{10}{2}\) = 5 Find the slope/rate of change for the French club. Find the slope using the given points by
Slope (m) = \(\frac{y_{2}-y_{1}}{x_{2}-x_{1}}\)
French club makes $\$5$ per car
where
(x2, y2) = (4, 20) and (x1, y1) = (2, 10)
slope = \(\frac{16-0}{2-0}\) = \(\frac{16}{2}\) = 8 Find the slope/rate of change for a soccer club. Find the slope using the given points by
Slope (m) = \(\frac{y_{2}-y_{1}}{x_{2}-x_{1}}\) where
(x2, y2) = (2, 16) and (x1, y1) = (0, 0)
Soccer club makes the most money per car Compare the money earned for washing one car $5 < $8
Texas Go Math Grade 8 Lesson 6.3 H.O.T. Focus On Higher Order Thinking Answer Key
Question 15.
Draw Conclusions Gym A charges $60 a month plus $5 per visit. The monthly cost at Gym B is represented by y = 5x + 40, where x is the number of visits per month. What conclusion can you draw about the monthly costs of gyms?
Answer:
Since the rate per visit is the same, the monthly cost of Gym A is always more than Gym B
Comparing Functions Worksheet 8th Grade Answers Question 16.
Justify Reasoning Why will the value of y for the function y = 5x + 1 always be greater than that for the function y = 4x + 2 when x > 1?
Answer:
y1 = 5x + 1 and y2 = 4x + 2 Subtracting y2 from y1 we get
y1 – y2 = 5x + 1 – (4x + 2)
y1 – y2 = x – 1
For x ≥ 1 we get x – 1 ≥ 0
So, y1 – y2 ≥ 0
or y1 ≥ y2
Hence proved.
Question 17.
Analyze Relationships The equations of two functions are y = -21x + 9 and y = -24x + 8. Which function is changing more quickly? Explain.
Answer:
To determine among the given equations of functions changing more quickly, we have to determine the absolute
value of slope of the equations and then compare them. If the absolute value of the slope of one equation is greater than the slope of the other, then this equation changing more quickly than the other.
Determining the slopes of the two equations below.
y = -21x + 9
y = -24x + 8
Since, the two equations are already in the form of y = mx + b, where m is the slope, it is easier to determine their slope and these are
| Equation | Slope |
|–|–|
|y = -21x + 9 | -21|
|y = -24x + 81 -24|
Now, Let us get the absolute values of the two slopes.
|- 21| = 21
|-24| = 24
The absolute value of the slope of the equation y = -21x + 9 is 21 while of the equation y = -24x + 8 is 24. Since 24 is greater than 21, then the equation y = -24x + 8 changes more quickly than the equation y = -21x + 9.
See the explanation
Texas Go Math Grade 8 Lesson 6.3 Answer Key Comparing Functions Read More »
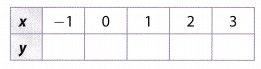
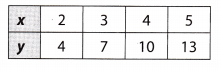
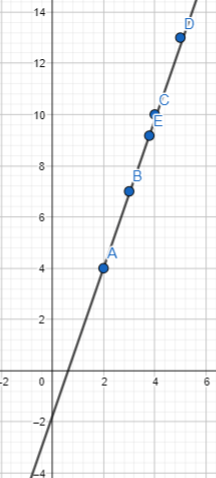


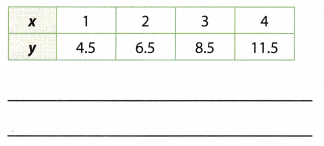
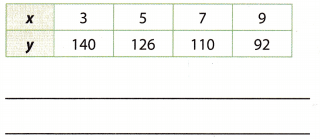


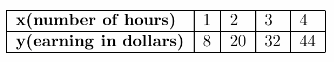
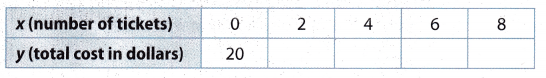
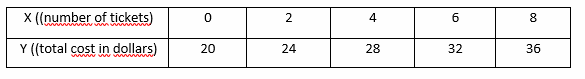
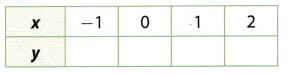

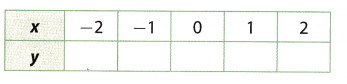
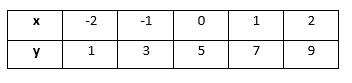
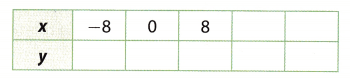
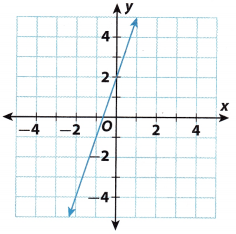
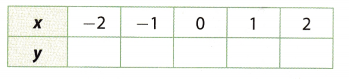
 Choose several values for x and substitute in the equation to find y. Make a table.