Texas Go Math Grade 5 Lesson 17.3 Answer Key Income
Refer to our Texas Go Math Grade 5 Answer Key Pdf to score good marks in the exams. Test yourself by practicing the problems from Texas Go Math Grade 5 Lesson 17.3 Answer Key Income.
Texas Go Math Grade 5 Lesson 17.3 Answer Key Income
Unlock the Problem
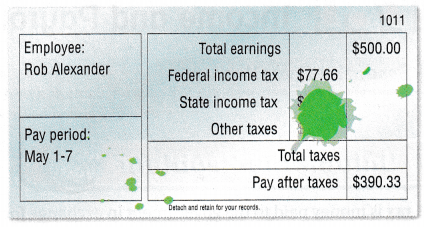
Jay works at a bank. Use the information in the pay stub to find his gross and net income for the week. The salary from the bank is Jay’s only source of income.
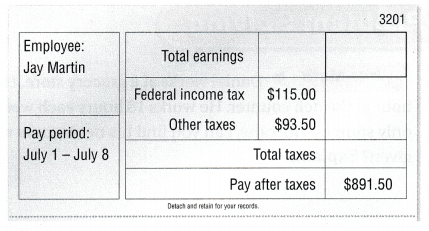
Since Jay has one source of income, his net income is the same as the pay after taxes shown on his pay stub. His gross income is the same as his total earnings.
His weekly net income is ____.
To find his gross income, add the payroll tax to his net income.
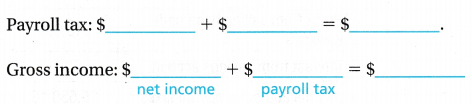
So, Jay’s gross income for the week is $____. Write the gross income on his pay stub.
Answer:
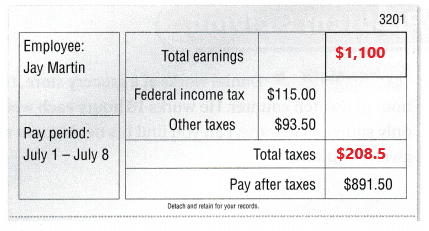
His weekly net income is $891.50.
To find his gross income, add the payroll tax to his net income.
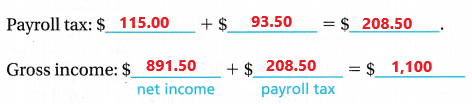
So, Jay’s gross income for the week is $1,100.
Explanation:
In the above table we can observe different taxes and net income. To find gross income first we have to calculate the payroll tax. Payroll tax is calculates by adding $Federal income tax $115.00 and other taxes $93.50 the sum is $208.50. To calculate net income add gross income with payroll tax. Add $891.50 with $208.50 then the sum is $1,100. So, Jay’s gross income for the week is $1,100.
• If Jay earns $130.56 after taxes during the same week from a part-time job, how does his net weekly income change? Explain.
Answer:
Share and Show
Use the information in the chart for 1-2.
Question 1.
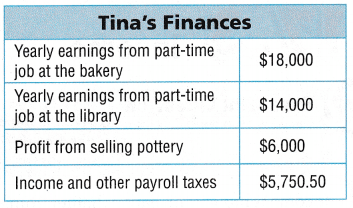
What is Tina’s gross income?
Think: Gross income is Tina’s total earnings from all her sources of income.
Gross income:
$____ + $______ + $ ____ = $_____
Answer:
Gross income:
$18,000 + $14,000 + $6,000 = $38,000
Tina’s gross income is $38,000.
Explanation:
In the above table we can observe Tina’s Finances. To calculate Tina’s gross income we have to add Tina’s earning. Add $18,000 with $14,00 and $6,000 then the sum is $38,000. Tina’s gross income is $38,000.
Question 2.
What is Tina’s net income?.
Net income: $____ – $____ = $__________
So, her net income is $ ______
Answer:
Net income: $38,000 – $5,750.50 = $32,249.50
So, Tina’s net income is $32,249.50.
Explanation:
In the above table, we can observe Tina’s Finances. To calculate Tina’s net income we have to subtract payroll tax from Gross income. Subtract $5,750.50 from $38,000 then the difference is $32,249.50. So, Tina’s net income is $32,249.50.
Lesson 17.3 Go Math Grade 5 Answer Key Question 3.
Write Math Daniel works at a grocery store. He earns $8.00 per hour at the deli counter. He works 18 hours each week. If this is Daniel’s only source of income, can you find his net income with the information given? Explain.
Answer:
He earns $8.00 per hour at the deli counter. He works 18 hours each week.
1 hour = $8.00
18 hours = ? $
18 x $8.00 = $144
Daniel net income in a week is $144.
Explanation:
Daniel works at a grocery store. He earns $8.00 per hour at the deli counter. He works 18 hours each week. Multiply 18 hours with $8.00 then the product is $144. Daniel net income in a week is $144.
Question 4.
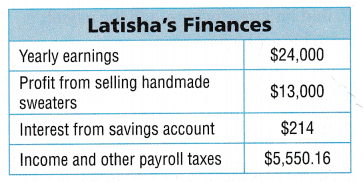
Use the information in the chart to find Latisha’s gross and net income for the year.
Answer:
Gross income = Yearly earnings + Profit from selling handmade sweaters + Interest from saving account
Gross income = $24,000 + $13,000 + $214 = 37,214
So, Latisha’s gross income is $37,214.
Net income = Gross income – Income and other payroll taxes
Net income = $37,214 – $5,550.16 = $31,663.84
So, Latisha’s net income is $31,663.84.
Explanation:
In the above chart we can observe Latisha’s Finances. To calculate the Latisha’s gross income we have to add Yearly earnings with Profit from selling handmade sweaters and Interest from saving account. Add $24,000 with $13,000 and $214 the sum is $37,214. So, Latisha’s gross income is $37,214.
To calculate the net income we have to subtract income and payroll taxes from Gross income. Subtract $5,550.16 from $37,214 the difference is $31,663.84. So, Latisha’s net income is $31,663.84.
Question 5.
Explain the relationship between gross income, payroll tax, and net income.
Answer:
The relationship between gross income, payroll tax, and net income is explained as below.
Gross income is nothing but total earnings of the person. Payroll tax is the total tax on a employer withholds. The tax is payed to the government. Net income is same as the Pay after taxes.
Gross income is our total income before income or other payroll taxes are taken out of it. Net income is the income left after taxes.
Problem Solving
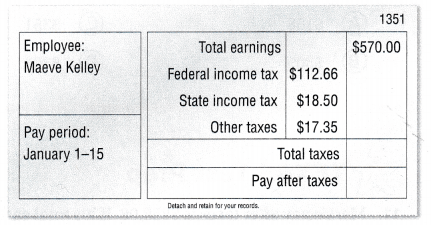
Question 6.
Multi-Step Eduardo worked for 45 hours last week. His pay is $12 per hour for 40 hours and $18 per hour for any time over 40 hours. His payroll tax was $98.06. If this is Eduardo’s only source of income, what was his net income for last week?
Answer:
Eduardo pay is $12 per hour for 40 hours.
1 hour = $12
40 hours = ? $
$12 x 40 = $480
His pay for 40 hours is $480.
His pay is $18 per hour for any time over 40 hours.
1 hour = $18
5 hours = ? $
5 x $18 = $90
His pay for extra 5 hours is $90.
His payroll tax was $98.06.
Gross income:
$480 + $90 = $570
Net income = Gross income – Payroll tax
Net income = $570 – $98.06 = $471.94
His net income for last week is $471.94.
Explanation:
Eduardo worked for 45 hours last week. His pay is $12 per hour for 40 hours and $18 per hour for any time over 40 hours. His payroll tax was $98.06.
Multiply $12 with 40 the product is $480. His pay for 40 hours is $480.
Multiply $18 with 5 the product is $90. His pay for extra 5 hours is $90.
Add $480 with $90 then the sum is $570. His gross income is $570.
Eduardo net income is calculated by subtracting payroll tax $98.06 from Gross income $570 then the difference is $471.94. His net income for last week is $471.94.
Texas Go Math 5th Grade Lesson 17.3 Answer Key Question 7.
H.O.T. Emily is a pharmacist. She earns $50 per hour. If she works on a holiday, she gets paid double the hourly rate. Last week she worked for 38 hours, including 8 hours on a holiday. Emily’s salary is her only source of income.
If her net income last week was $1,947, how much was her payroll tax? Explain.

Answer:
Emily earns $50 per hour. Last week she worked for 38 hours, including 8 hours on a holiday.
1 hour = $50
30 hours = $?
$50 x 30 = $1,500
Emily earns $1,500 for 30 hours.
If she works on a holiday, she gets paid double the hourly rate.
1 hour = $100
8 hours = $?
$100 x 8 = $800
Emily earns $800 for 8 hours on a holiday.
Emily’s Gross income = $1,500 +$800 = $2,300
If her, net income last week is $1,947.
Emily’s Payroll tax = Gross income – Net income
Payroll tax = $2,300 – $1,947 = $353
Explanation:
Emily is a pharmacist. She earns $50 per hour. If she works on a holiday, she gets paid double the hourly rate. Last week she worked for 38 hours, including 8 hours on a holiday. Multiply $50 with 30 hours the product is $1,500. Emily earns $1,500 for 30 hours. Multiply $100 with 8 extra hours the product is $800. Emily earns $800 for 8 hours on a holiday. Add $1,500 with $800 then the sum is $2,300. Emily’s Gross income is $2,300. If her, net income last week is $1,947. Payroll tax is obtained by subtracting net income $1,947 from gross income $2,300 the difference is $353.
Question 8.
Multi-Step Charlie’s total earnings from his job are $45,000. He also earned $2,000 in profit from selling quilts. He pays $18 tax for every $100 in gross income. What is Charlie’s net income?
Answer:
Charlie’s total earnings from his job are $45,000. He also earned $2,000 in profit from selling quilts.
Total gross income = $45,000 + $2,000 = $47,000
He pays $18 tax for every $100 in gross income.
$47,000 which is $470 x $100
$470 x $18 = $8,460
The payroll tax is $8,640.
Charlie’s net income = Gross income – payroll tax
Net income = $47,000 – $8,460 = $38,540
Charlie’s net income is $38,540.
Explanation:
Charlie’s total earnings from his job are $45,000. He also earned $2,000 in profit from selling quilts. Add $45,000 with $2,000 the sum is $47,000. Total gross income is $47,000. He pays $18 tax for every $100 in gross income. Multiply $470 with $18 the product is $8,460. The payroll tax is $8,640. To calculate Charlie’s net income we have to subtract payroll tax $8,460 from Gross income $47,000 then the difference is $38,540. Charlie’s net income is $38,540.
Go Math Grade 5 Lesson 17.3 Answer Key Question 9.
Apply Geno works at a music store where he earns $16.25 per hour. He works 40 hours per week. Should he take a new job with a gross income of $36,000 per year? Explain your reasoning.
Answer:
Geno works at a music store where he earns $16.25 per hour. He works 40 hours per week.
1 hour = $16.25
40 hours = $?
$16.25 x 40 = $650
For one week he earns $650.
1 year is equal to 52 weeks
1 week = $650
52 weeks = ?$
$650 x 52 = $33,800
At music store he earns $33,800 per year.
He earns $33,800 per year at music store. So he can take a new job with a gross income of $36,000 per year.
Explanation:
Geno works at a music store where he earns $16.25 per hour. He works 40 hours per week. Multiply $16.25 with 40 hours the product is $650. For one week he earns $650. We know that one year is equal to 52 weeks. Multiply 52 weeks with $650 the product is $33,800. At music store he earns $33,800 per year. So he can take a new job with a gross income of $36,000 per year.
Daily Assessment Task
Fill in the bubble completely to show your answer.
Question 10.
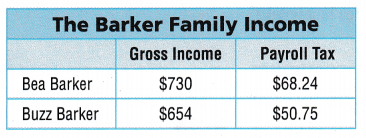
The table shows the gross income and payroll tax for the Barker family members for one week. What is their net income for the week?
(A) $1,285.01
(B) $1,315.76
(C) $1,264.95
(D) $1,265.01
Answer:
Gross income of the barker family = Bea Barker + Buzz Barker
Gross income = $730 + $654 = $1,384
Payroll Tax of the barker family = Bea Barker + Buzz Barker
Payroll Tax = $68.24 + $50.75 = $118.99
Net income = Gross income – Payroll tax
Net income = $1,384 – $118.99 = $1,265.01
Net income for the week is $1,265.01.
So, Option D is correct.
Explanation:
In the above table we can observe Gross income and payroll tax in Barker family income. Add Bea Barker gross income $730 with Buzz Barker gross income $654 then the sum is $1,384. Add Bea Barker payroll tax $68.24 with Buzz Barker payroll tax $50.75 then the sum is $118.99. Net income is calculated by subtracting payroll tax $118.99 from gross income $1,384 then the difference is $1,265.01. Net income for the week is $1,265.01. So, Option D is correct.
Question 11.
Lana works at the local ice cream store. In the last four weeks, her gross income was $120.75, $118.50, $99.75, and $115.75. Her total payroll tax was $59.70. How can you find her net income for the four weeks?
(A) Find the sum of the gross income. Then add the payroll tax.
(B) Add $59.70 to each of the gross incomes. Then add the sums.
(C) Find the sum of the gross incomes.
(D) Find the sum of the gross incomes. Then subtract the payroll tax.
Answer:

Option D is correct.
Explanation:
Lana works at the local ice cream store. In the last four weeks, her gross income was $120.75, $118.50, $99.75, and $115.75. Her total payroll tax was $59.70. Her net income for the four weeks is calculated by first adding the four gross incomes and then subtracting the payroll tax. So option D is correct.
Question 12.
Multi-Step Abe earned money mowing lawns. He earned $25 Saturday morning and $75 Saturday afternoon. He earned $100 on Sunday. A payroll tax of $26.25 was withheld each day. If this is Abe’s only source of income, what was his net income for the two days?
(A) $73.75
(B) $147.50
(C) $122.25
(D) $173.75
Answer:
Abe earned $25 Saturday morning and $75 Saturday afternoon.
Total earnings on Saturday is $25 + $75 = $100.
He earned $100 on Sunday.
A payroll tax of $26.25 was withheld each day.
Net income = Gross income – Payroll Tax
Saturday net income is $100 – $26.25 = $73.25
Sunday net income is $100 – $26.25 = $73.25
His net income for the two days is $73.25 + $73.25 = $147.50
So option B is correct.
Explanation:
Abe earned money mowing lawns. He earned $25 Saturday morning and $75 Saturday afternoon. Add total earning on Saturday. Add $25 with $75 the sum is $100. He earned $100 on Sunday. A payroll tax of $26.25 was withheld each day. Saturday net income is calculated by subtracting payroll tax $26.25 from gross income tax $100 then the difference is $73.25. Sunday net income is calculated by subtracting payroll tax $26.25 from gross income tax $100 then the difference is $73.25. His net income for the two days is $147.50. So option B is correct.
Texas Test Prep
Grade 5 Answer Key Go Math Lesson 17.3 Question 13.
Sari works in a flower shop for 36 hours each week. She earns $9.75 per hour. The wages from this job are Sari’s only source of income. What is her net weekly income if her payroll tax is $73 for the week?
(A) $317
(B) $351
(C) $424
(D) $278
Answer:
Sari works in a flower shop for 36 hours each week. She earns $9.75 per hour.
1 hour = $9.75
36 hours = ? $
$9.75 x 36 = $351
Sari earns $351 for 36 hours each week.
Her payroll tax is $73 for the week.
Net weekly income = Gross weekly income – payroll tax
Net weekly income = $351 – $73 = $278
So option D is correct.
Explanation:
Sari works in a flower shop for 36 hours each week. She earns $9.75 per hour. Multiply 36 hours with $9.75 the product is $351. Sari earns $351 for 36 hours each week. Her payroll tax is $73 for the week. To calculate Net weekly income we have to subtract payroll tax $73 from Gross weekly income $351 then the difference is $278. So option D is correct.
Texas Go Math Grade 5 Lesson 17.3 Homework and Practice Answer Key
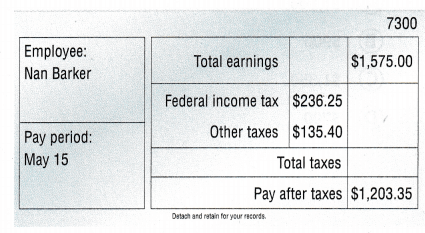
Nan Barker lives in a state with no state income tax. Her only source of income is from her job at a technology company. Use Nan’s pay stub for 1-4.
Question 1.
What is Nan’s gross income for the pay period? ____
Answer:
Answer:
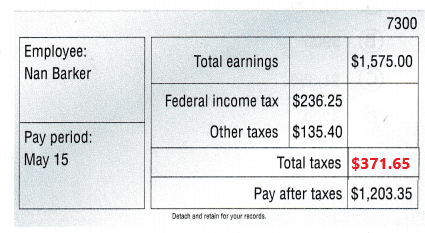
Nan’s gross income for the pay period is $1,575.00.
Explanation:
Nan Barker lives in a state with no state income tax. Her only source of income is from her job at a technology company. In the above Nan’s pay stub table we can observe the gross income for the pay period. Gross income is same as total earnings. Nan’s gross income for the pay period is $1,575.00.
Question 2.
What is Nan’s net income for the pay period? ____
Answer:
Nan’s net income for the pay period is $1,203.35.
Explanation:
In the above Nan’s pay stub table we can observe the net income. Net income is same as pay after taxes. Nan’s net income for the pay period is $1,203.35.
Question 3.
Nan is paid twice a month. What is Nan’s net income each month?
Answer:
Nan’s net income each month
$1,203.35 + $1,203.35 = $2,4067
Explanation:
In the above Nan’s pay stub table we can observe the net income for 15 days. Net income is same as pay after taxes. Nan’s net income each month is calculated by adding 15 days net income $1,203.35 with another 15 days net income $1,203.35 then the sum is $2,4067.
Question 4.
Describe two ways to find the difference between Nan’s gross income and her net income for the pay period.
Answer:
Problem Solving
Use Dante’s weekly pay stub for 5-6.
Go Math 5th Grade Homework Answers Lesson 17.3 Question 5.
If the earnings from this job are Dante’s only source of income, what is his net income for the week?
Answer:
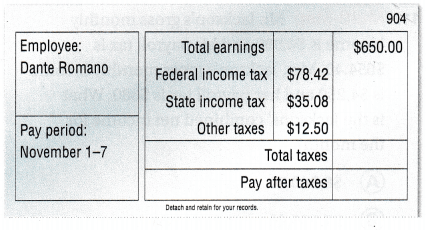

Payroll tax = $78.42 + $35.08 + $12.50 = $126.00
Gross income = $650.00
Net income = Gross income – Payroll tax
Net income = $650.00 – $126.00 = $524.00
Dante net income for the week is $524.00.
Explanation:
In the above Dante’s weekly pay stub table we can observe total earnings and different types of taxes. Payroll is calculated by adding different types of taxes which are Federal income tax, State income tax, Other taxes. Add $78.42 with $35.08 and $12.50 then the sum is $126.00. Gross income is $650.00. Net income is calculated by subtracting payroll tax $126.00 from gross income $650 then the difference is $524.00. ante net income for the week is $524.00.
Question 6.
What is Dante’s annual gross income? Explain how you found your answer.
Answer:
Dante’s weekly gross income is $650.00.
1 year = 52 weeks
1 week = $650.00
52 weeks = ? $
$650.00 x 52 = $33,800
Dante’s annual gross income is $33,800.
Explanation:
Dante’s weekly gross income is $650.00. We know that one year is equal to 52 weeks. Multiply $650.00 with 52 weeks then the product is $33,800. Dante’s annual gross income is $33,800.
Lesson Check
Texas Test Prep
Fill in the bubble completely to show your answer.
Question 7.
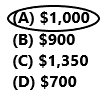
Keenan worked 45 hours last week. His pay is $20 per hour for 35 hours and $30 per hour for any time over 35 hours. If the earnings from the job are his only source of income, what was Keenan’s gross income for last week?
(A) $1,000
(B) $900
(C) $1,350
(D) $700
Answer:
Keenan pay is $20 per hour for 35 hours
1 hour = $20
35 hours = $?
$20 x 35 =$700
Keenan pay is $700 for 35 hours.
Kennan pay is $30 per hour for any time over 35 hours.
1 hour = $30
10 hours = $?
$30 x 10 = $300
Keenan pay is $300 for 10 hours extra.
His gross income = $700 + $300 = $1,000
So option A is correct.
Explanation:
Keenan worked 45 hours last week. His pay is $20 per hour for 35 hours. Multiply $20 with 35 hours then the product is $700. Keenan pay is $700 for 35 hours. Kennan pay is $30 per hour for any time over 35 hours. Multiply $30 with 10 hours then the product is $300. Keenan pay is $300 for 10 hours extra. Gross income is calculated by adding $700 with $300 the sum is $1,000. So option A is correct.
Question 8.
Rita’s gross income last month was $2,948.45. She paid $442.45 in payroll tax for the month. How can you find Rita’s net income for one week if there were four weeks in the month?
(A) Add the payroll tax to the gross income and multiply by 4.
(B) Subtract the payroll tax from the gross income and multiply by 4.
(C) Add the payroll tax to the gross income and divide by 4.
(D) Subtract the payroll tax from the gross income and divide by 4.
Answer:
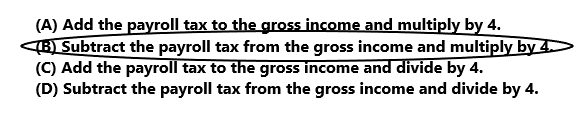
Option B is correct.
Explanation:
Rita’s gross income last month was $2,948.45. She paid $442.45 in payroll tax for the month. First we have to subtract the payroll tax from the gross income and then we have to multiply by 4. So, Option B is correct.
Question 9.
Chip works at the amusement park. In the last four weeks, his gross income was $112.25, $98.75, $125.50, and $109.25. His total payroll tax was $62.30. If the earnings from this job are Chip’s only source of income, what was his net income for the four weeks?
(A) $445.75
(B) $196.55
(C) $383.45
(D) $508.05
Answer:
Gross income = $112.25 + $98.75 + $125.50 + $109.25 = $445.75
Chip’s Gross income for four weeks is $445.75.
His total payroll tax was $62.30.
Net income = Gross income – Payroll tax
Net income = $445.75 – $62.30 = $383.45
Chip’s Net income for four weeks is $383.45.
So option C is correct.
Explanation:
Chip works at the amusement park. In the last four weeks, his gross income was $112.25, $98.75, $125.50, and $109.25. Add $112.25, $98.75, $125.50, and $109.25 then the sum is $445.75. Chip’s Gross income for four weeks is $445.75. His total payroll tax was $62.30. Net income is calculated by subtracting payroll tax $62.30 from gross income $445.75 then the difference is $383.45. Chip’s Net income for four weeks is $383.45. So option C is correct.
Question 10.
Jenna’s only source of income is from her job at a car wash, where she works 25 hours each week. She is paid $9.90 per hour. What is her net weekly income if she pays $30.70 in payroll tax each week?
(A) $247.50
(B) $216.80
(C) $278.20
(D) $217.20
Answer:

Jenna’s works 25 hours each week. She is paid $9.90 per hour.
1 hour = $9.90
25 hours = ? $
$9.90 x 25 = $247.50
Jenna’s weekly gross income is $247.50.
She pays $30.70 in payroll tax each week.
Net income = Gross income – Payroll tax
Net income = $247.50 – $30.70 = $216.80
So, option B is correct.
Explanation:
Jenna’s only source of income is from her job at a car wash, where she works 25 hours each week. She is paid $9.90 per hour. Multiply $9.90 with 25 hours then the product is $247.50. Jenna’s weekly gross income is $247.50. She pays $30.70 in payroll tax each week. Net income is calculated by subtracting payroll tax $216.80 from gross income $247.50 the difference is $216.80. So, option B is correct.
Question 11.
Multi-Step Mr. Jackson’s gross monthly income is $4,090 and his payroll tax is $654.40. Mrs. Jackson’s gross monthly income is $4,250 and her payroll tax is $680. What is the Jacksons’ combined net income for the month?
(A) $8,340.00
(B) $7,005.60
(C) $9,674.40
(D) $6,905.60
Answer:
Mr. Jackson’s gross monthly income is $4,090 and his payroll tax is $654.40.
Net income = Gross income – Payroll tax
Net income = $4,090 – $654.40 = $3,435.60
Mrs. Jackson’s gross monthly income is $4,250 and her payroll tax is $680.
Net income = $4,250 – $680 = $3,570
Jacksons’ combined net income for the month
$3,435.60 + $3,570 = $7,005.60
So, option B is correct.
Explanation:
Mr. Jackson’s gross monthly income is $4,090 and his payroll tax is $654.40. Subtract $654.40 from $4,090 the difference is $3,435.60. Net income is $3,35.60. Mrs. Jackson’s gross monthly income is $4,250 and her payroll tax is $680. Subtract $680 from $4,250 the difference is $3,570. Net income is $3,570. Jacksons’ combined net income for the month is calculated by adding 3,435.60 with 3,570 the sum is $7,005.60. So, option B is correct.
Question 12.
Multi-Step Ari worked for a moving company last weekend. On Saturday, his gross income was $350 and his net income was $307.05. On Sunday, his gross income was $280 and his net income was $246.35. How much did Ari pay in payroll tax last weekend?
(A) $76.60
(B) $103.00
(C) $137.30
(D) $70.00
Answer:
On Saturday, his gross income was $350 and his net income was $307.05.
Payroll tax = Gross income – Net income
Payroll tax = $350 – $307.05 = $42.95
Ari payroll tax on Saturday is $42.95.
On Sunday, his gross income was $280 and his net income was $246.35.
Payroll tax = $280 – $246.35 = $33.65
Ari payroll tax on Sunday is $33.65.
Payroll tax in last weekend is $42.95 + $33.65 = $76.60
Ari payed $76.60 in payroll tax last weekend.
So option A is correct.
Explanation:
Ari worked for a moving company last weekend. On Saturday, his gross income was $350 and his net income was $307.05. Subtract $307.05 from $350 the difference is $42.95. Ari payroll tax on Saturday is $42.95. On Sunday, his gross income was $280 and his net income was $246.35. Subtract $246.35 from $280 the difference is $33.65. Ari payroll tax on Sunday is $33.65. Add payroll tax on Saturday $42.95 with payroll tax on Sunday $33.65 then the sum is $76.60. Ari payed $76.60 in payroll tax last weekend. So option A is correct.
Texas Go Math Grade 5 Lesson 17.3 Answer Key Income Read More »